
by Mirzo Jonuzokov (Edited by Tuan Luong)
Highlights:
- Age, education are the main drivers of income and expenditures.
- There is some evidence that non-single people would be more affected by the rising costs of food, non-alcoholic beverages and household/housing services.
- Transportation make up the most of the expenses.
Concerns about the cost of living are currently one of the economic challenges that people encounter most frequently. The COVID-19 pandemic only exacerbated the problem. In this report, we make use of the latest living costs survey, undertaken by the Office for National Statistics (ONS) Social Survey Operations from April 2019 to March 2020. More than 5000 households participated in the survey. They reported their weekly expenditure on goods and services in a very detailed manner that allowed us to investigate their spending behaviours.
Prior to the pandemic, average weekly household spending in the UK was £587.90. Lower-income families generally spent more on necessities such as housing, food, and transportation than higher-income households. In comparison to those in the lowest income decile, households in the highest income decile spent about five times as much on discretionary items like leisure, culture, dining out, and hotels.
Age is the main driver of income and expenditures, as shown in Table 1. The income (bottom panel) of a typical person would gradually rise until they are in the mid 30s, then remain more or less at the same level until at the age of 50 when it starts to gradually decline. The expenditures (top panel) follow the same pattern, although they are more stable than income for pensioners (aged over 70). These results show that young people might have borrowing difficulties to smooth their consumption, while the elderly can rely on their savings.
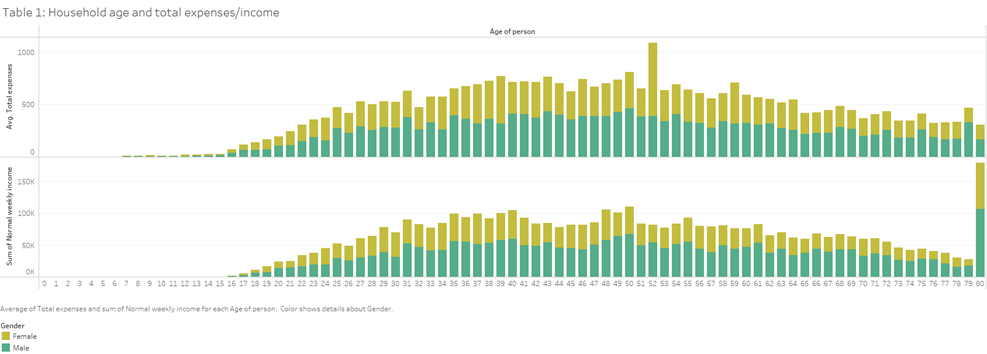
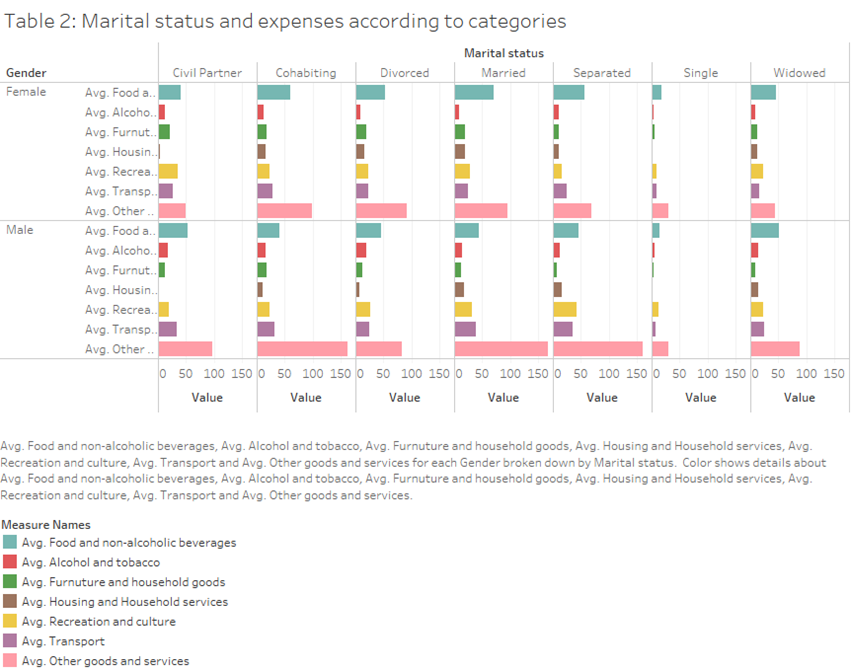
Table 2 demonstrates how spending preferences vary by marital status. Single people spend significantly less on food and non-alcoholic beverages than others. It is possible that although these expenditures are on an individual basis, non-single people might have bought food for their dependents. Single people also spent less on other categories, especially on housing and household services.
Education is another main driver of income and expenditures, as shown in Table 3. The biggest spenders are the people who have a degree above A-levels. People with low GCSE grades or no formal qualifications had low spending budgets. While there is no significant difference between men and women among the big spenders, women tend to spend more than men at the bottom of the spending ranking. Similarly, higher degrees result in higher income. The highest earners are men working full-time with a degree or equivalent, or men working part-time with some qualification below a degree. People with only GCSE grades are at the bottom of the income ranking.
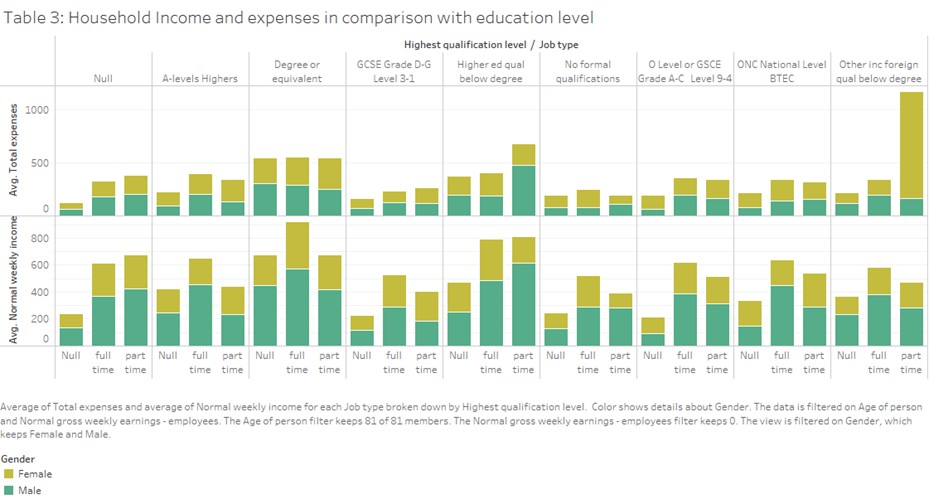
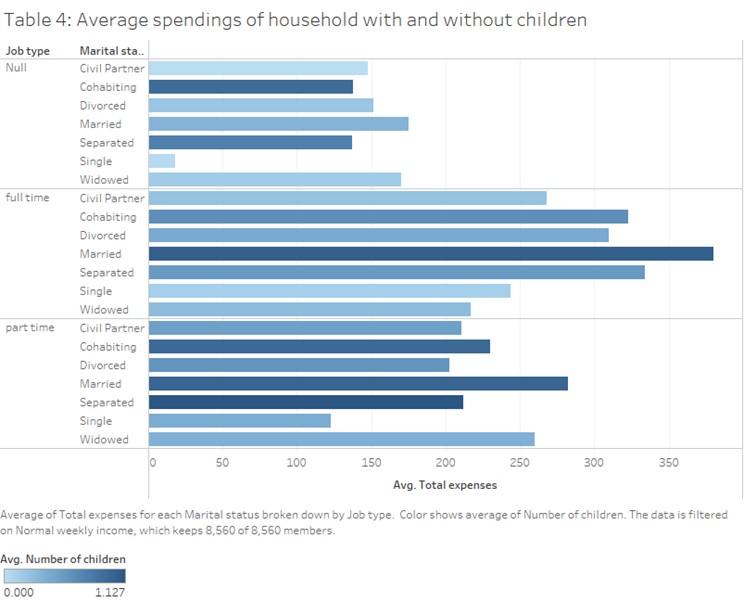
Table 4 illustrates how children’s presence affects overall expenses broken down by categories of people’s employment and marital status. The statistics support the widespread belief that married people spend more on children and have more children on average than those in other types of relationships. Note that cohabiting individuals spend less money than married individuals while having more children in the group null, which refers to unemployed individuals. It is clear that people who live with a civil partner tend to have a weak desire for procreation. Additionally, when it comes to the number of children, part-timers with a separated status typically have more kids than part-timers with neighbouring statuses. Although they spend twice as much as a married couple at full-time employment, they have an average of around the same number of children.
Finally, we used descriptive statistics to analyse 9 categories of expenses from the survey. Transportation costs make up the majority of expenses. It implies that the rise in fuel prices put tremendous pressure on a typical household. The next important parts of expenses are housing/household services, and recreation/culture.

Mirzo Jonuzokov is a MSc student from De Montfort University. This report is part of the training program, funded by the Higher Education Innovation Fund (
HE.0046.04.02.01).
It was an incredible experience, thanks in large part to Professor Tuan Luong! Tuan Luong is one of the university’s best in macroeconomics and data analysis, with outstanding insights and perspective of the economic landscape.