The Index of Multiple Deprivation is compiled every few years by the Ministry of Housing Communities and Local Government. The most recent Index is from 2019. The Index ranks areas on deprivation across seven domains – (i) income, (ii) employment, (iii) education, skills and training, (iv) health and deprivation, (v) crime, (vi) barriers to housing and services, (vii) living environment. A distinguishing feature of the Index is that it is calculated at a very local area level (Lower Layer Super Output Areas). This allows us to map deprivation within towns, cities and regions.
You can read more about deprivation in Leicester and Nottingham with our data brief.
You can also read how health deprivation appears to be associated with negative Covid-19 outcomes in the East Midlands.
A map of deprivation by local area, comparing 2019 and 2015 is available through the IoD2019 Explorer.
There is also an interactive Local Authority dashboard.
Index of Deprivation in East Midlands (2019)
In the following interactive graph you can see the deprivation index of local authorities in the East Midlands across the 7 domains. A high number indicates relatively high deprivation.
Source: Ministry of Housing, Communities and Local Government – English Indices of Deprivation
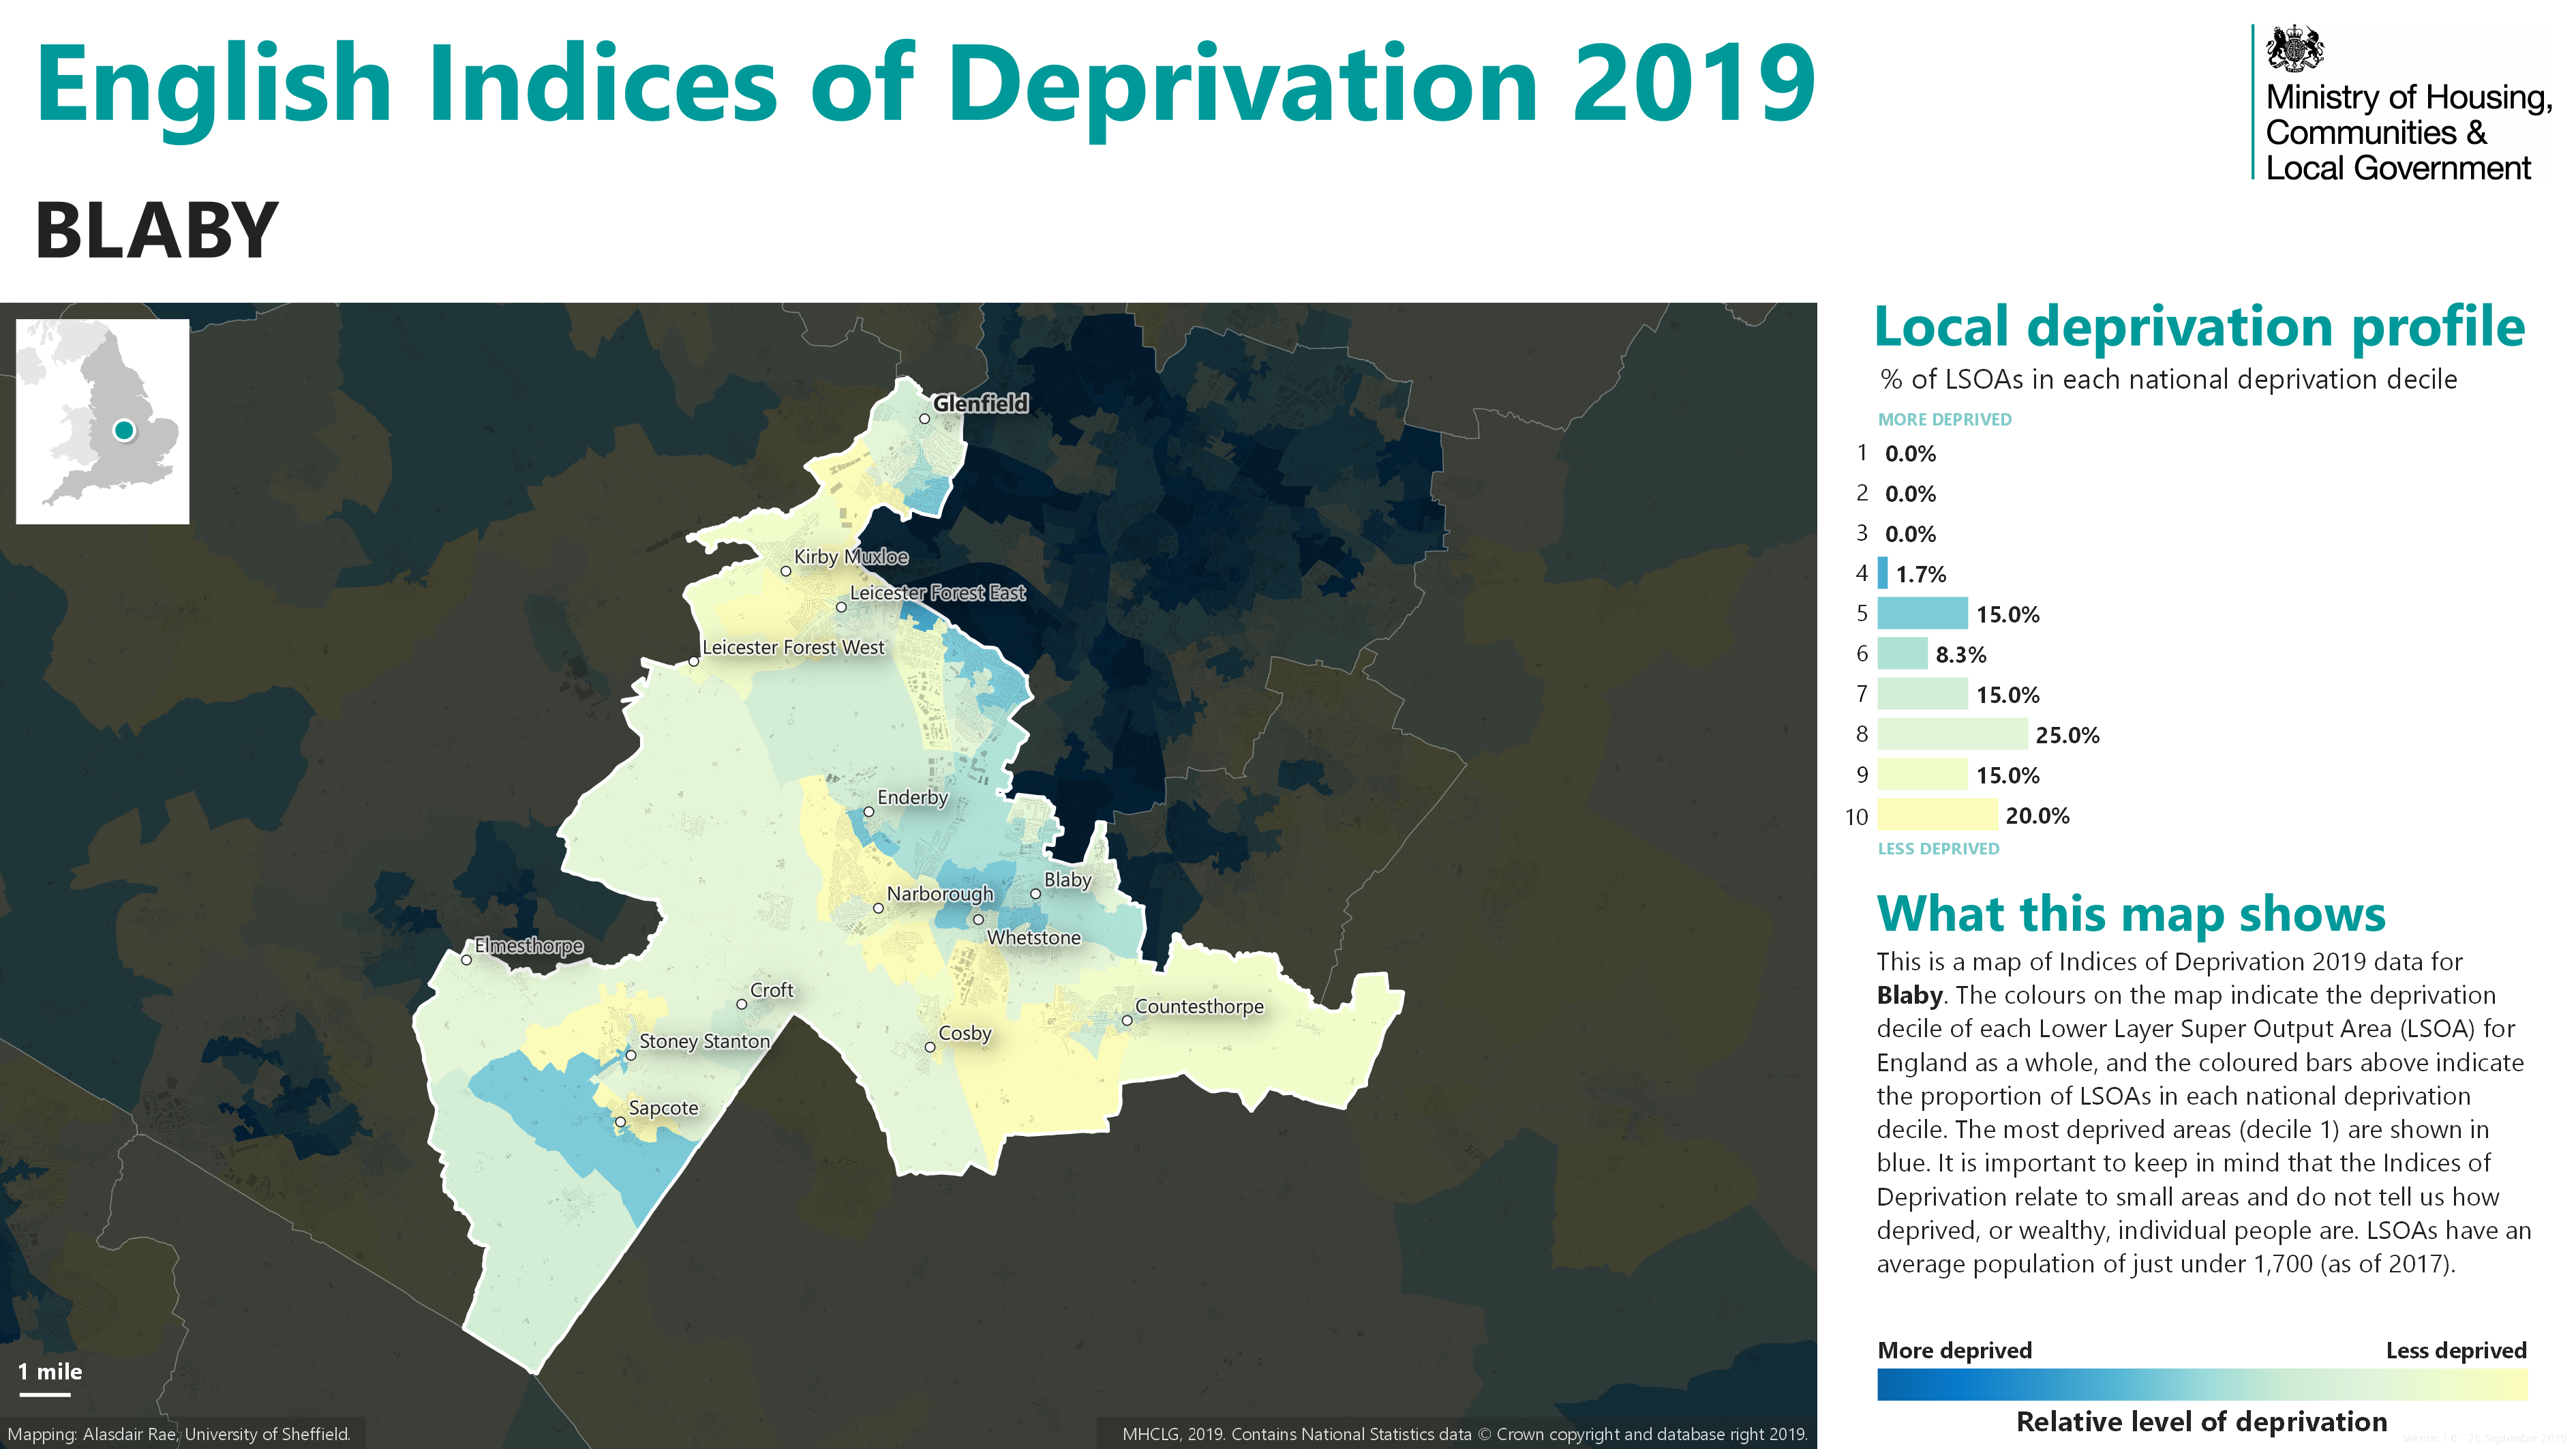
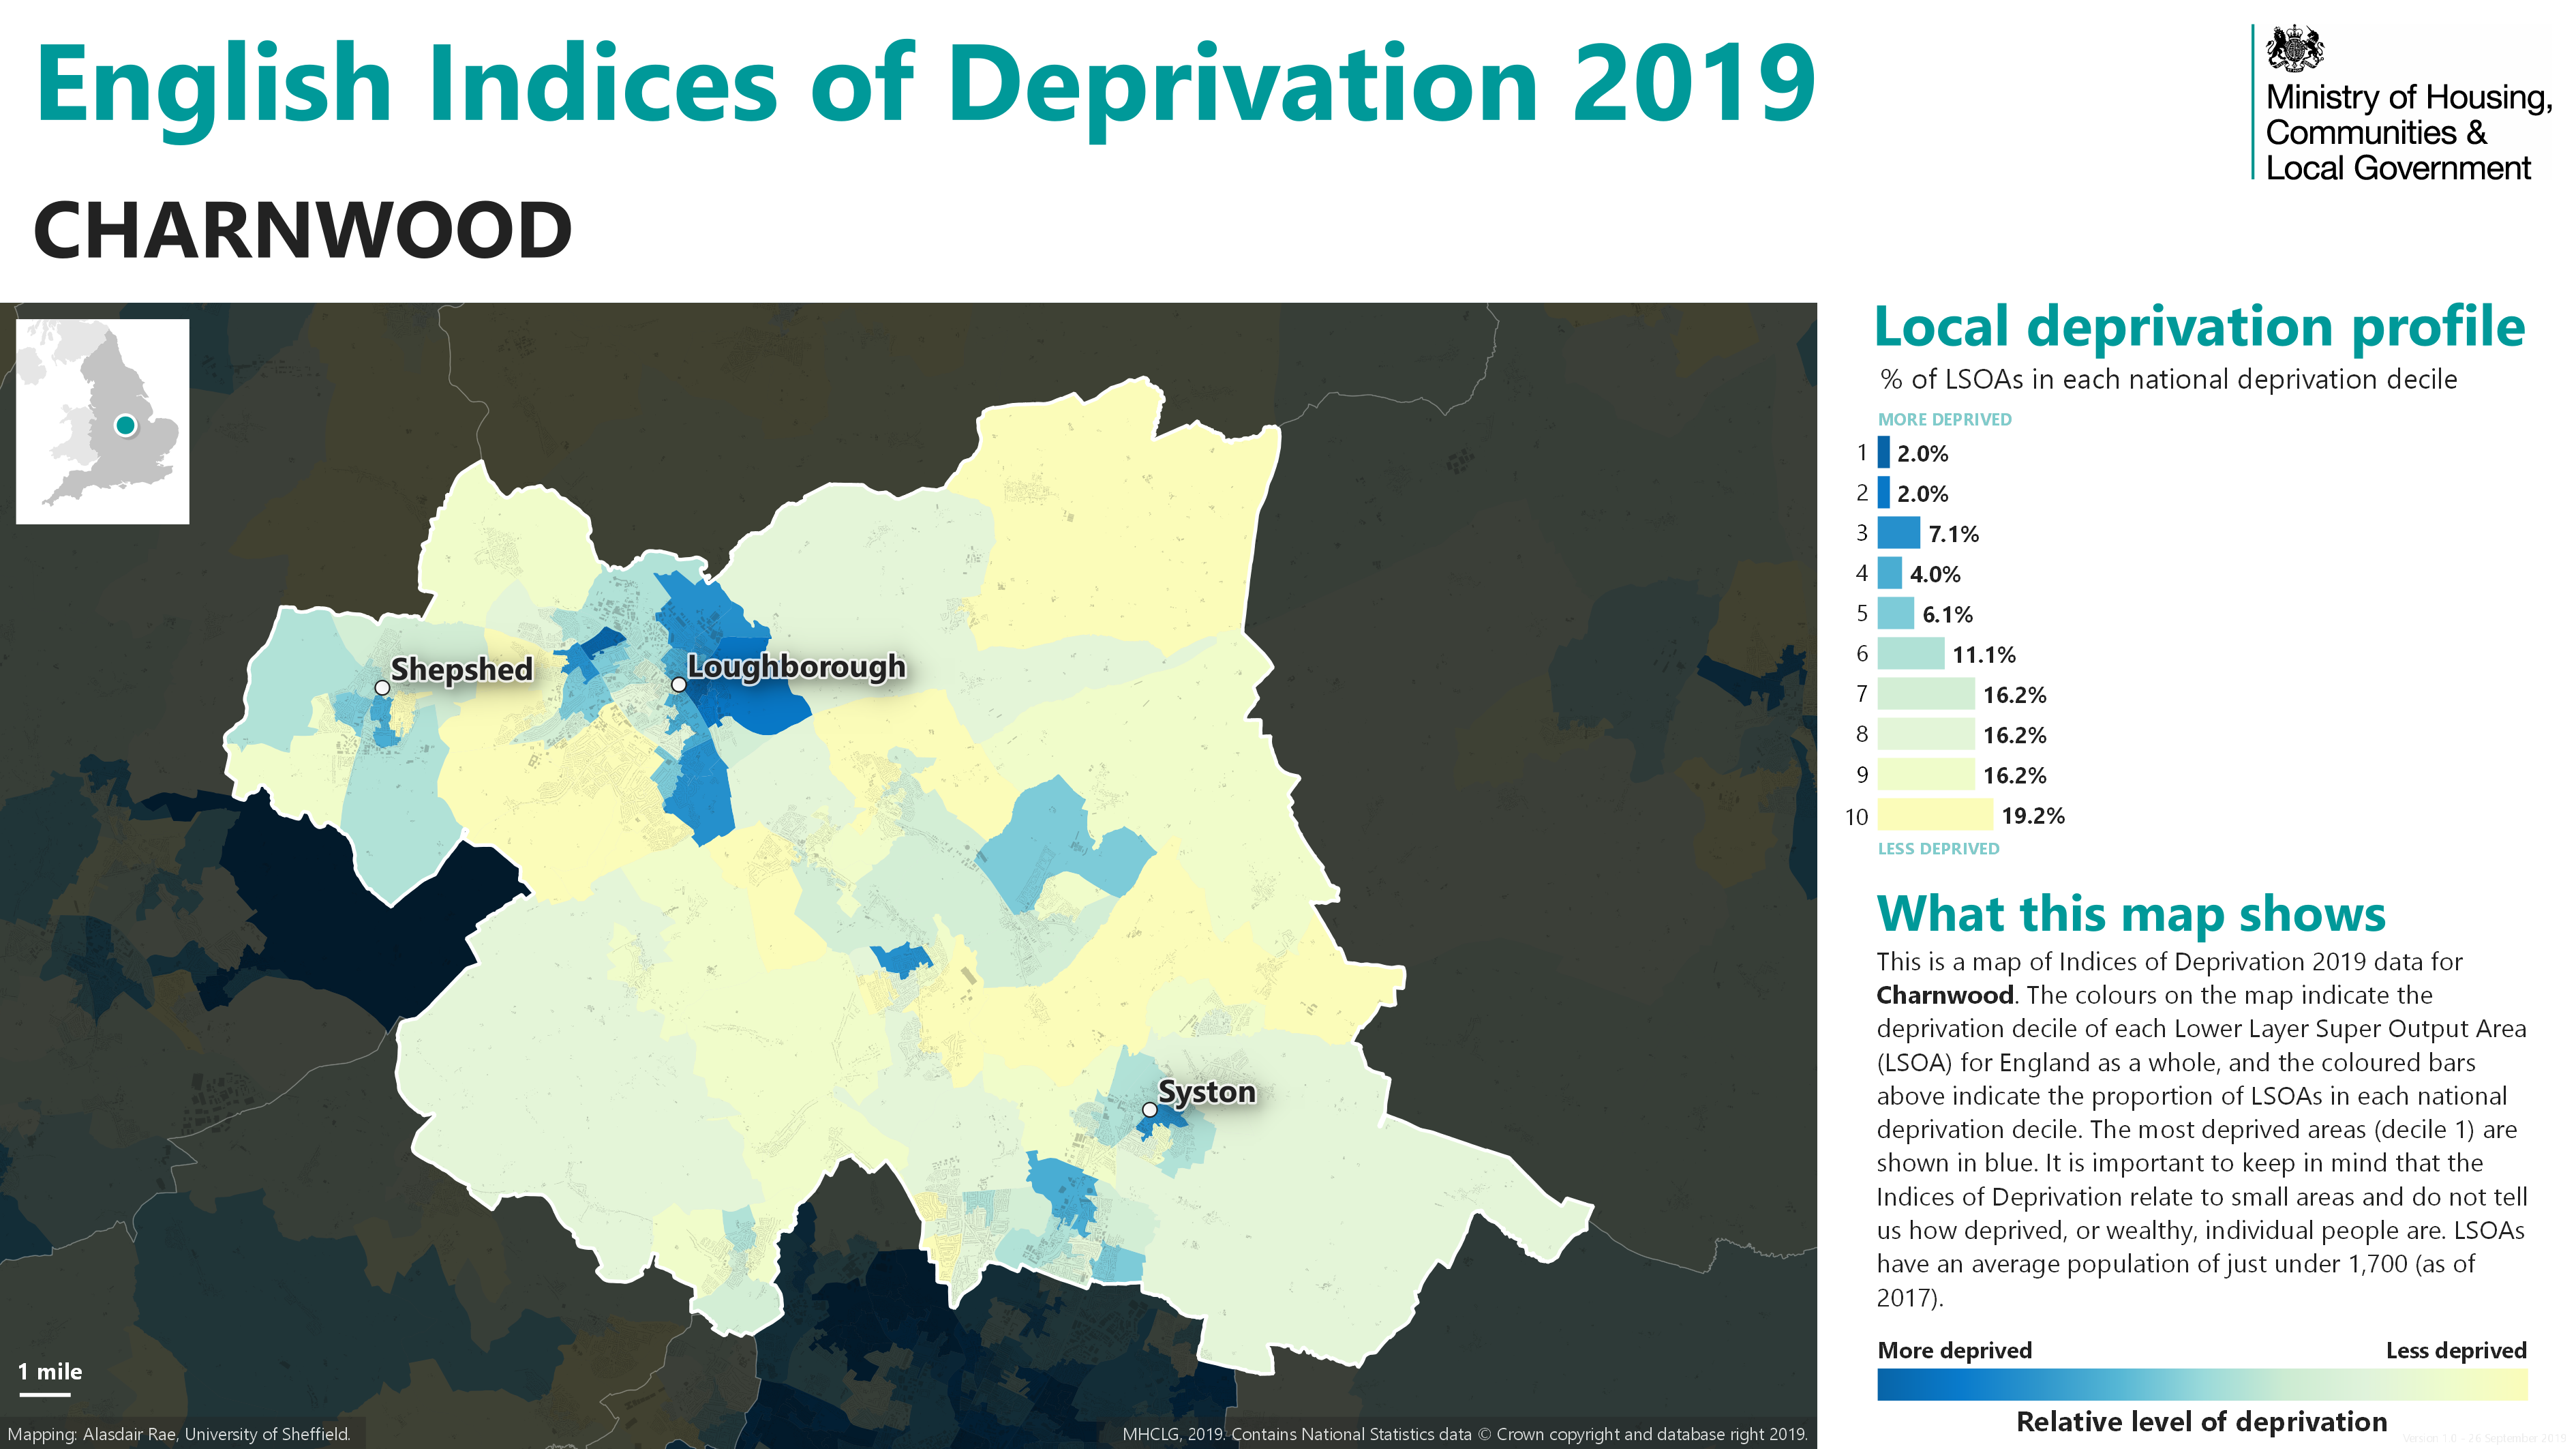
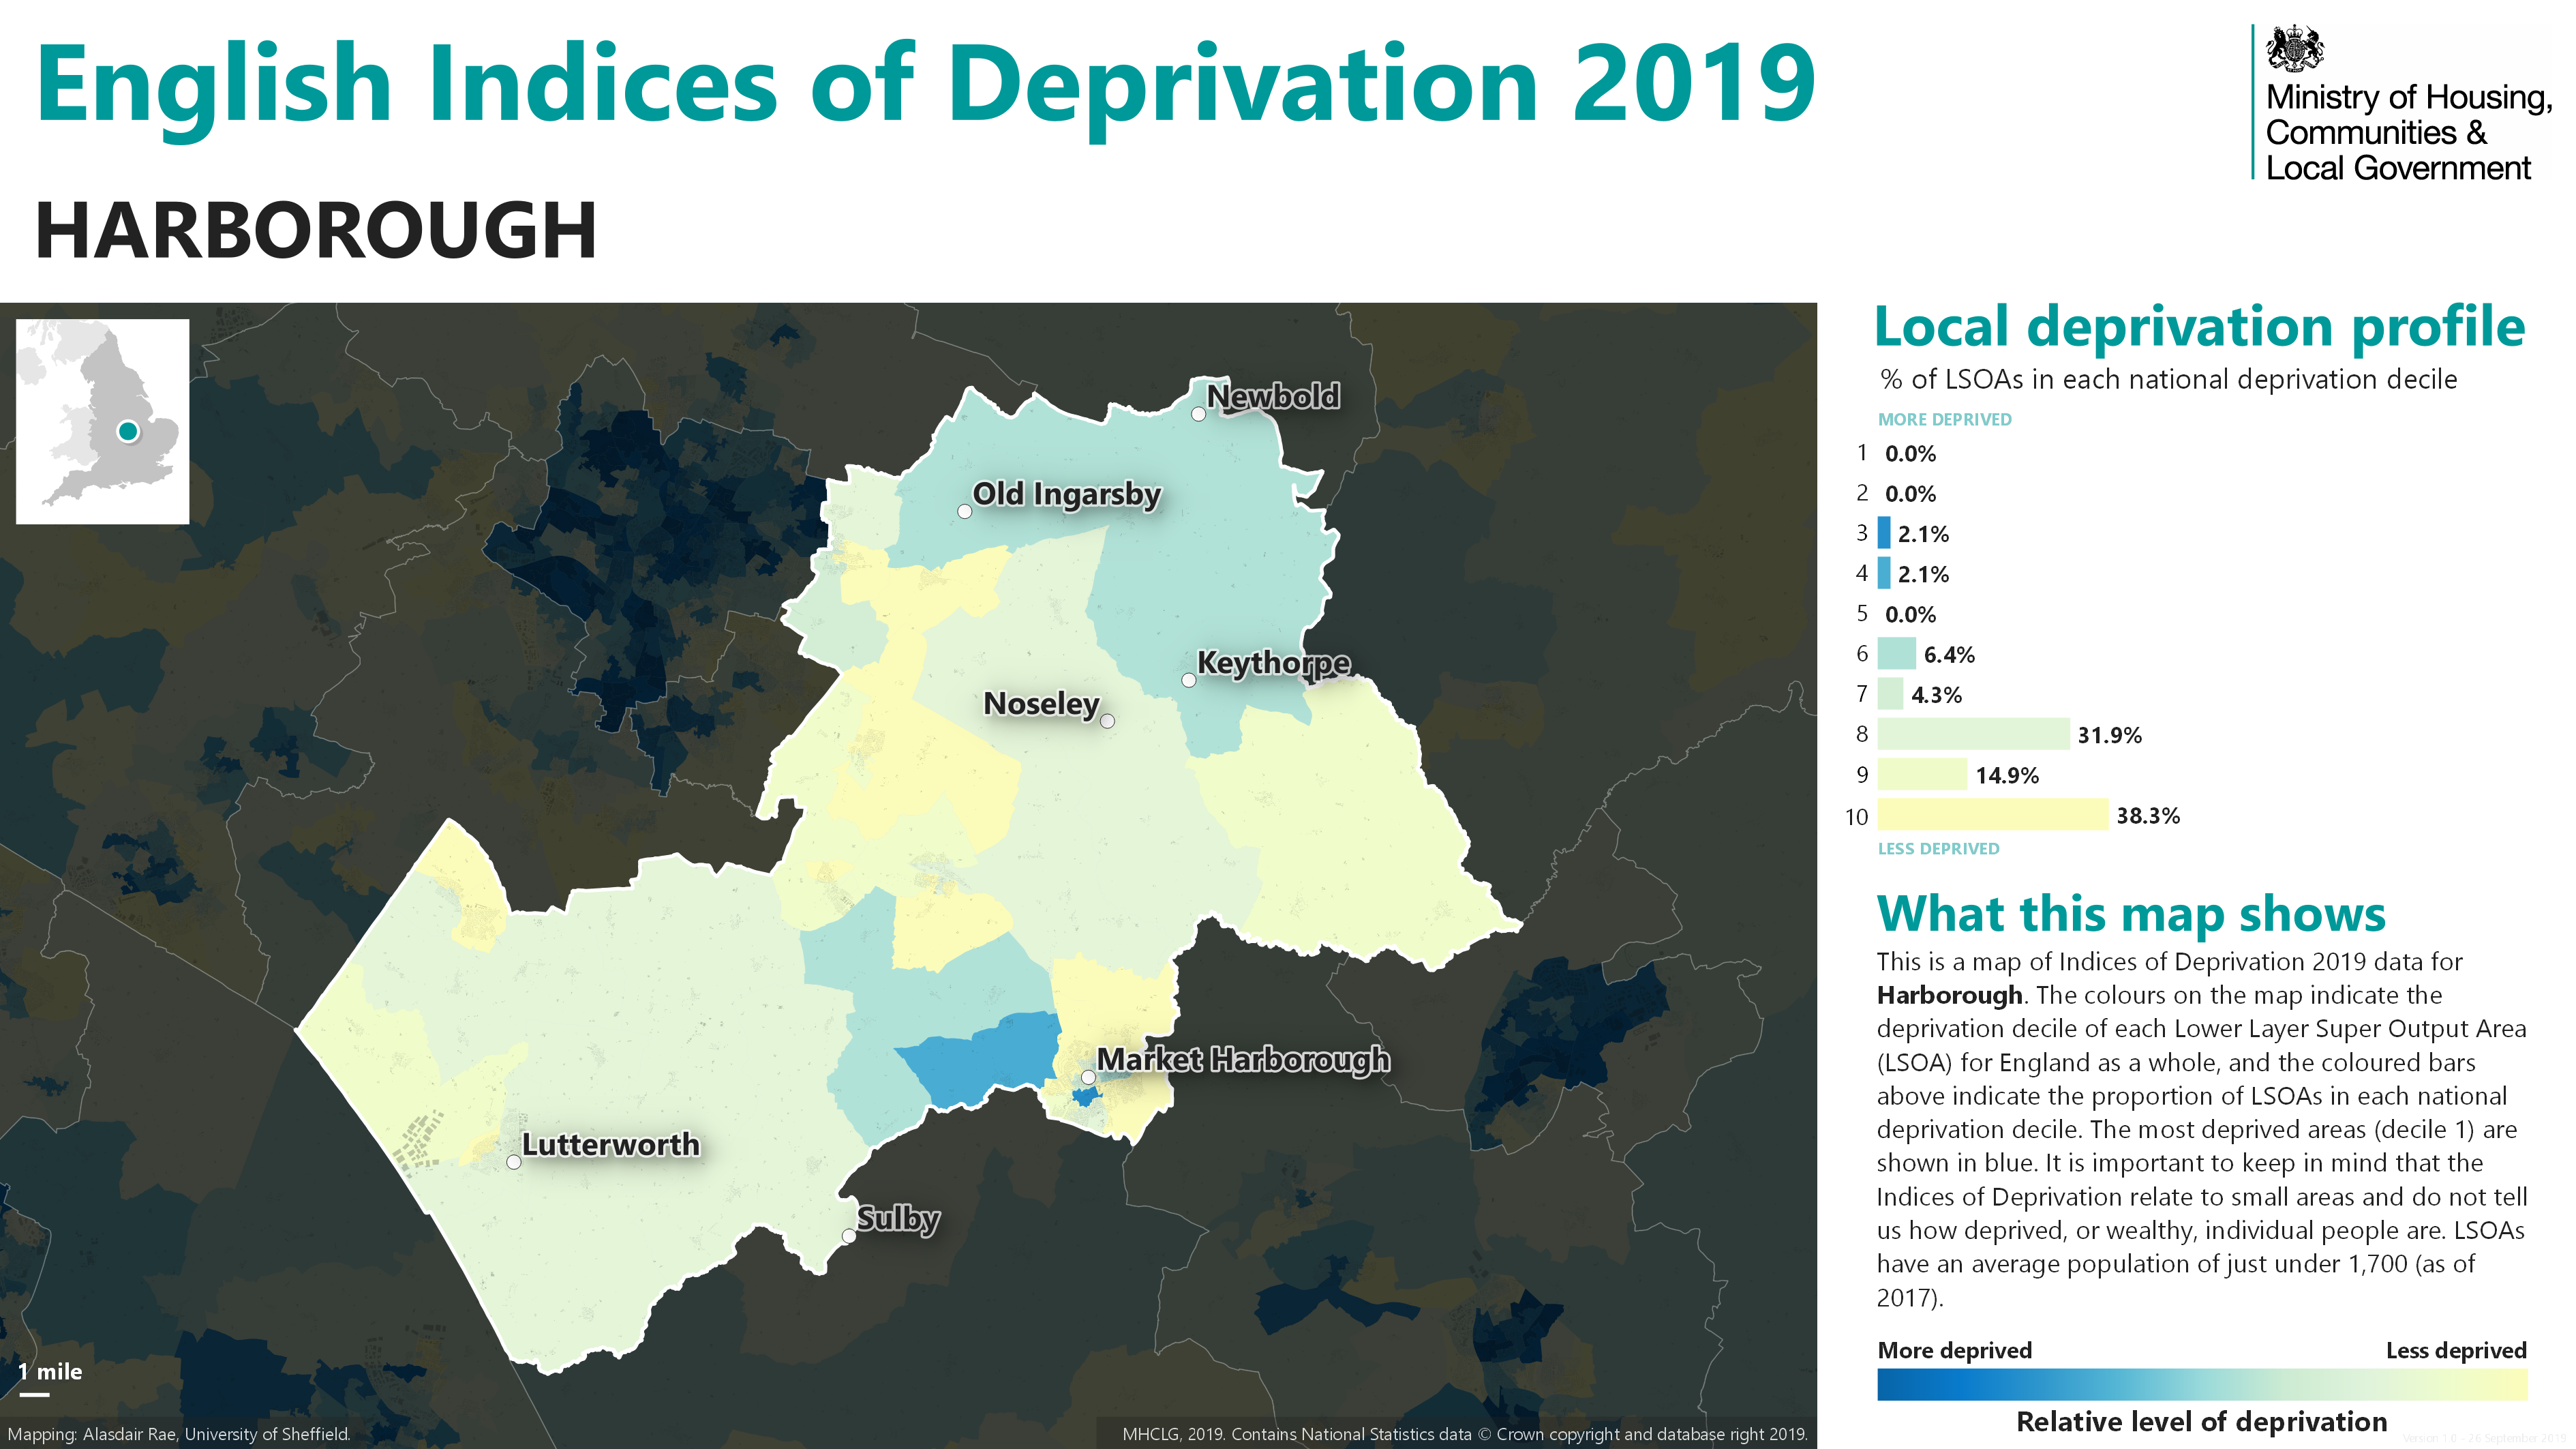
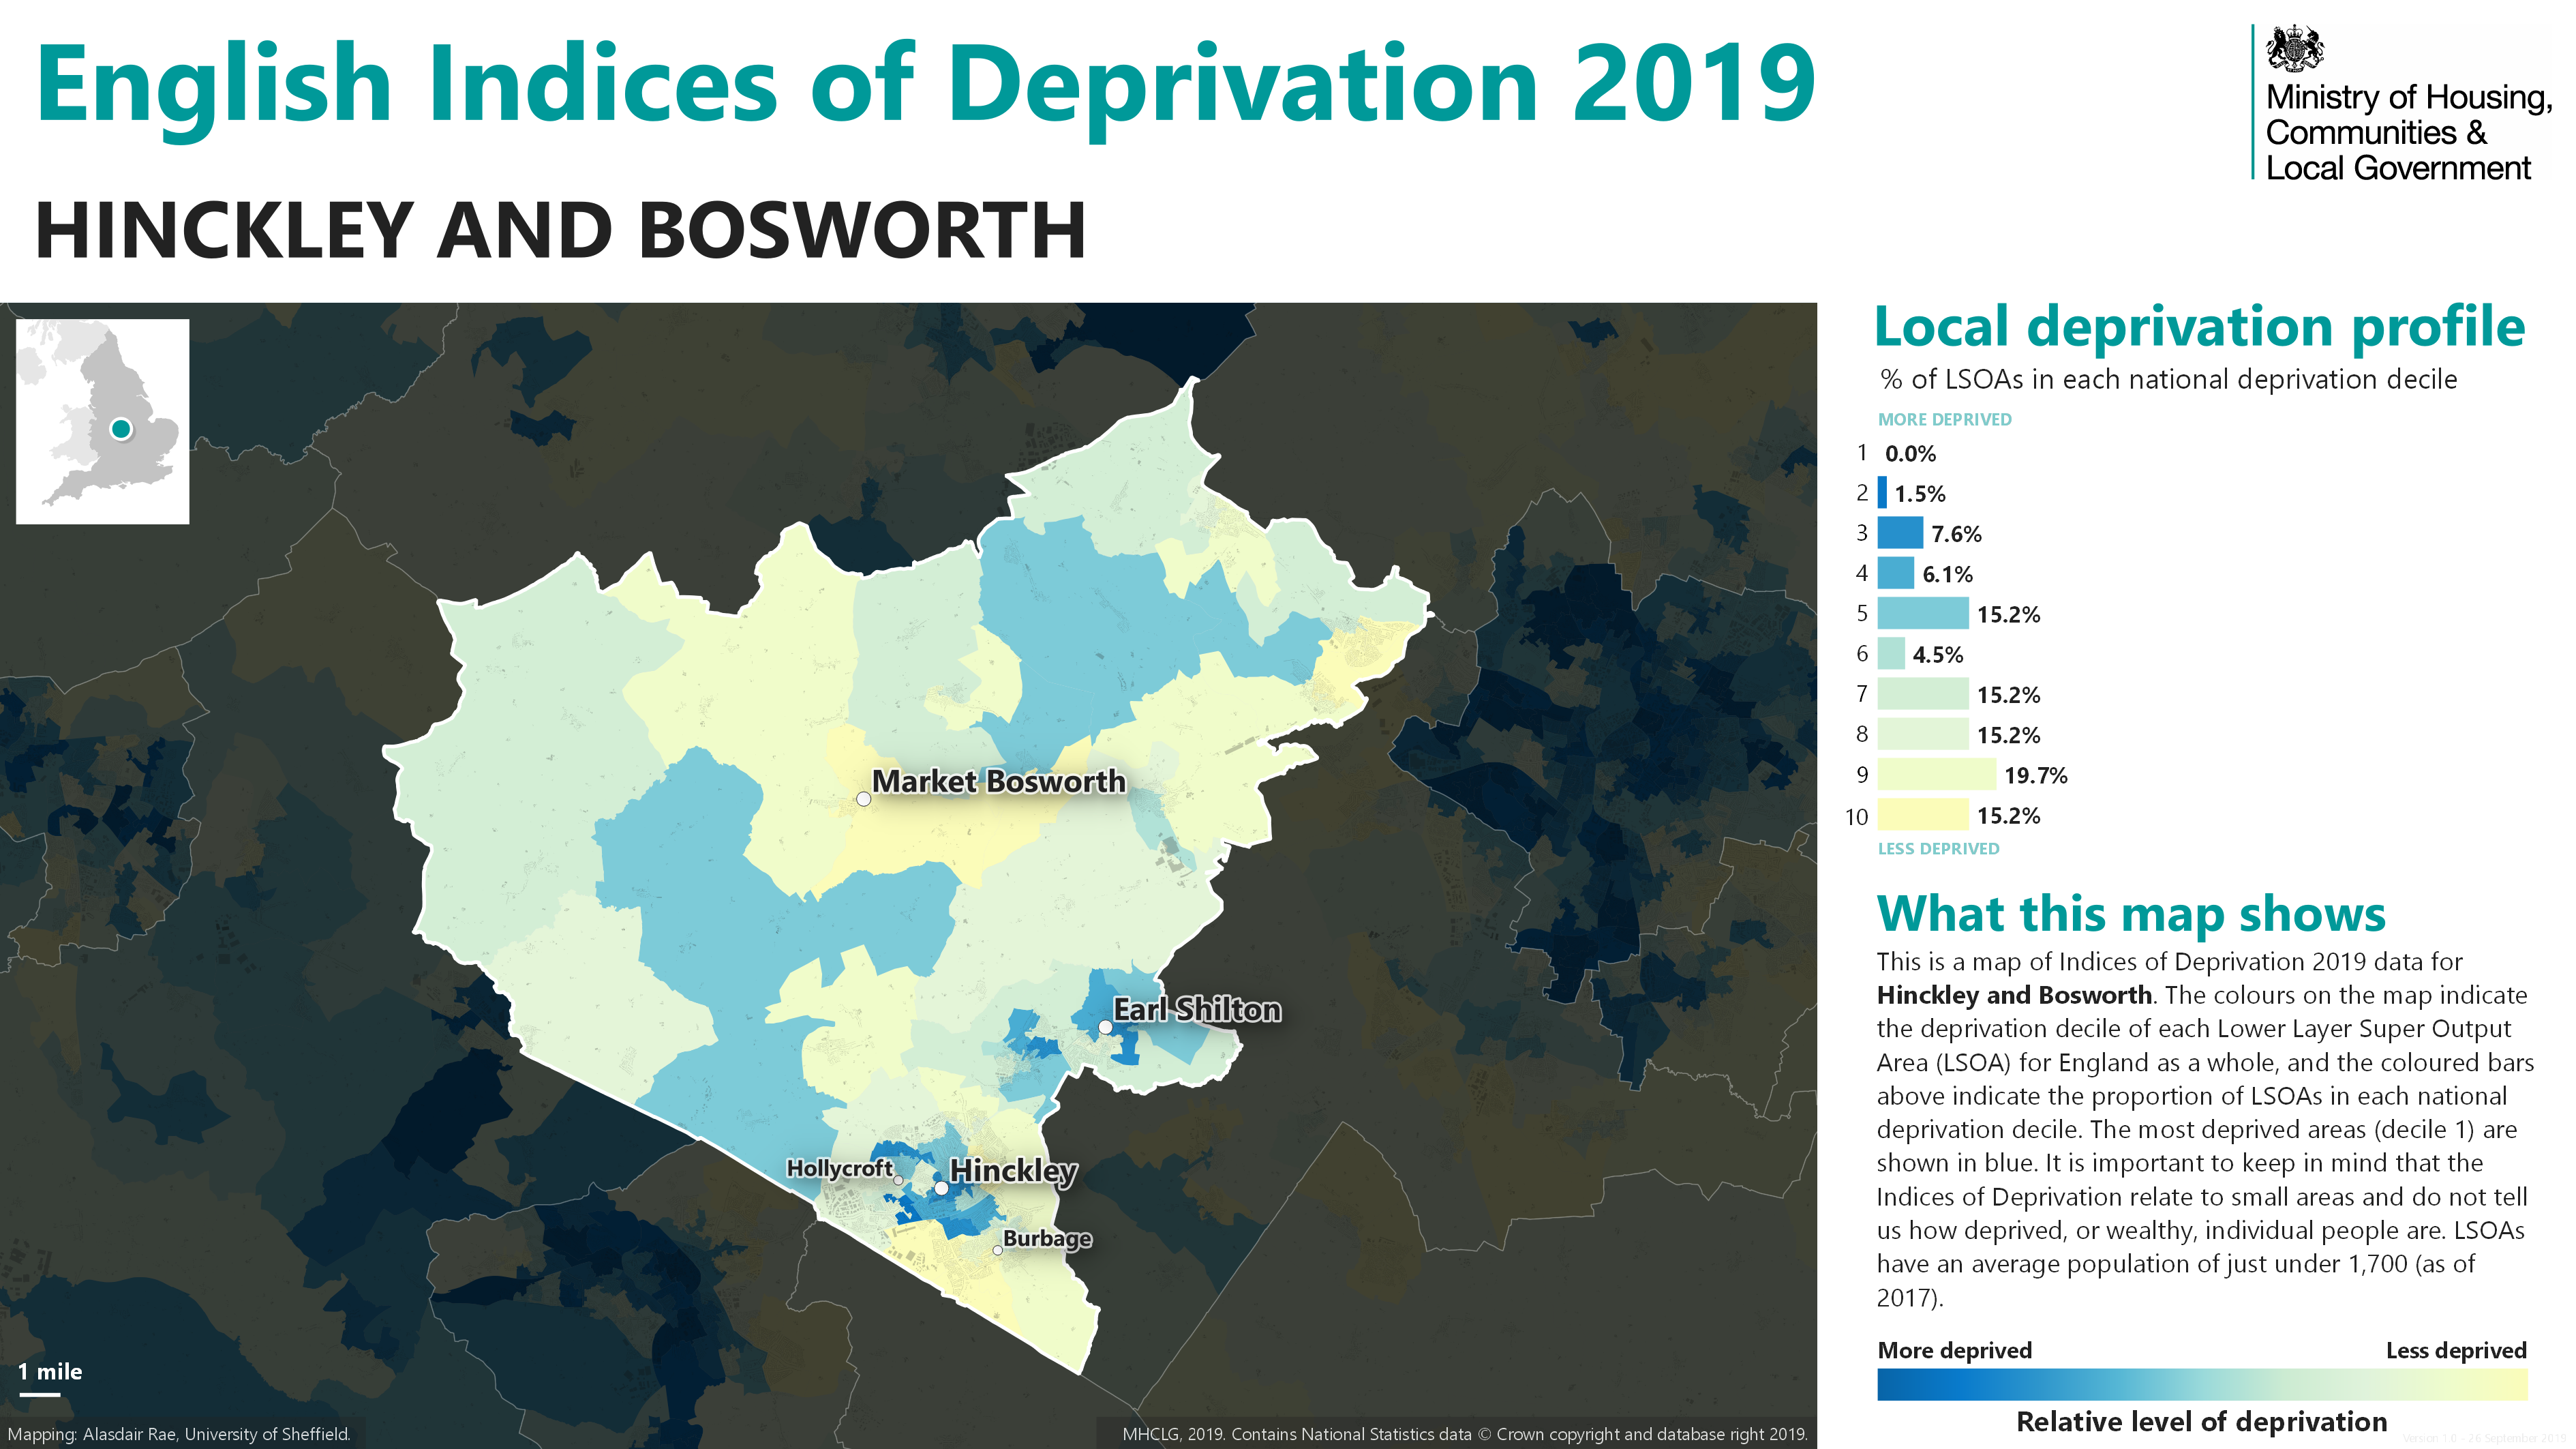
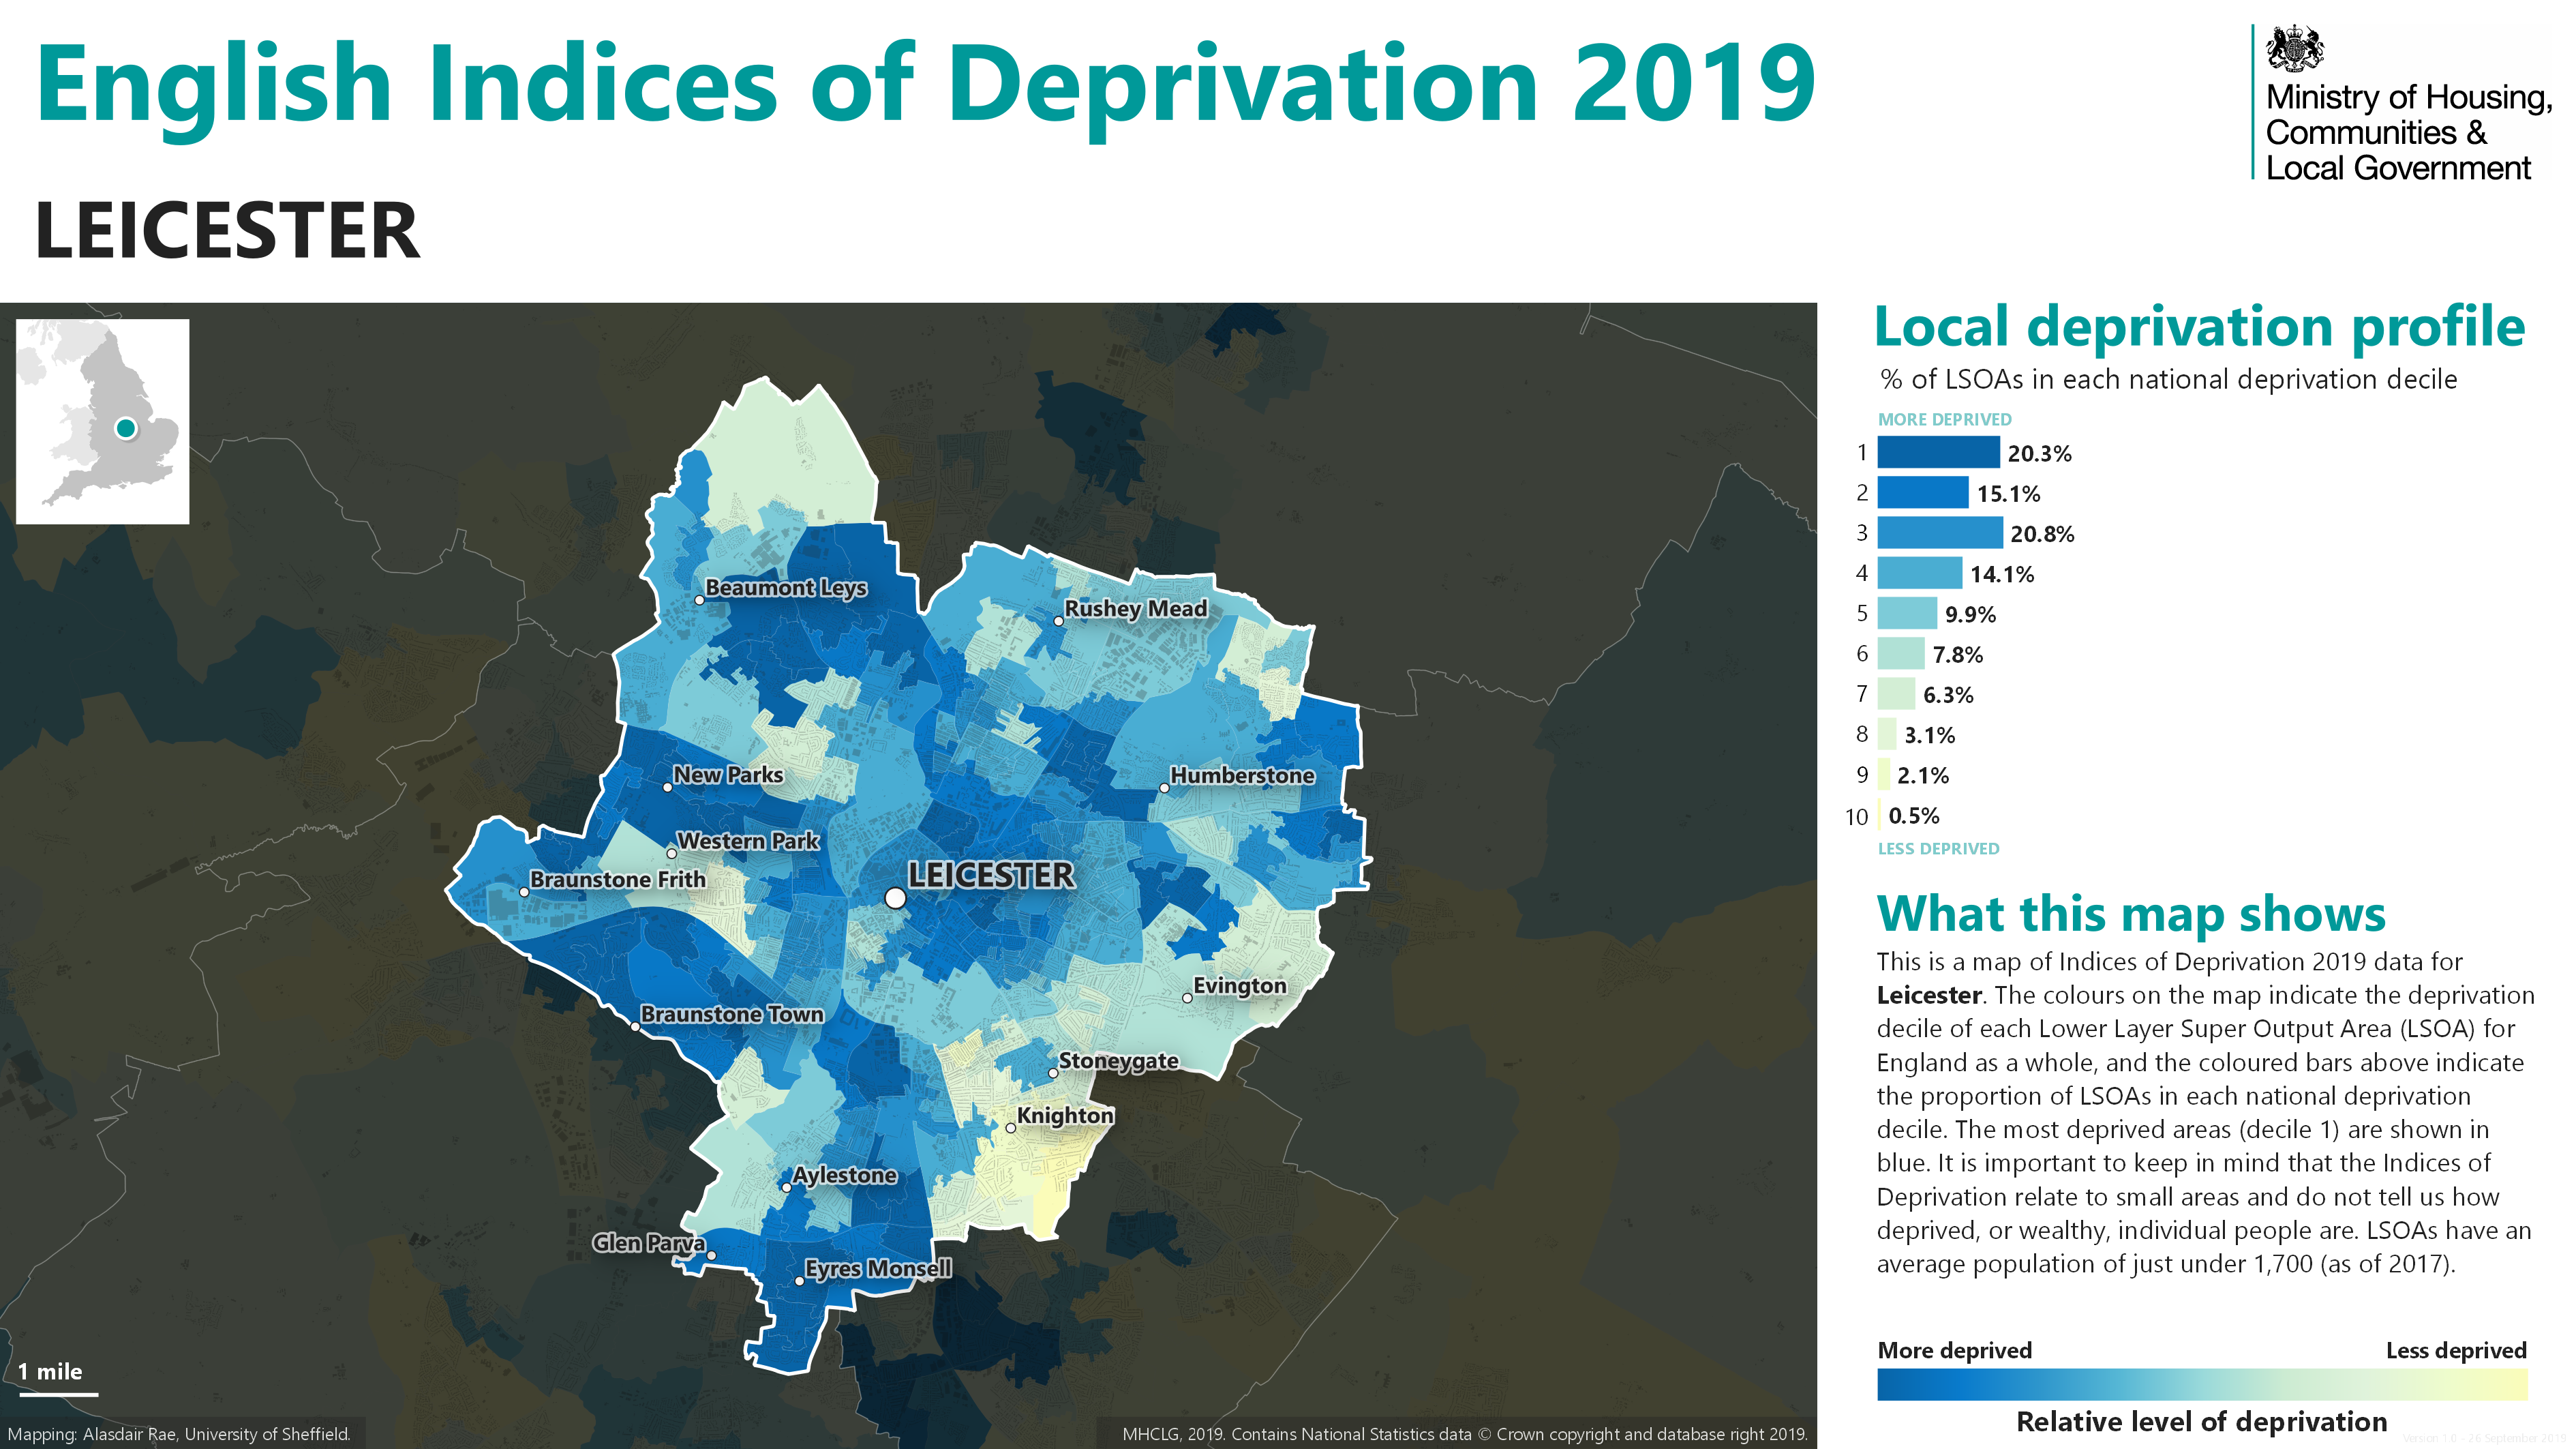
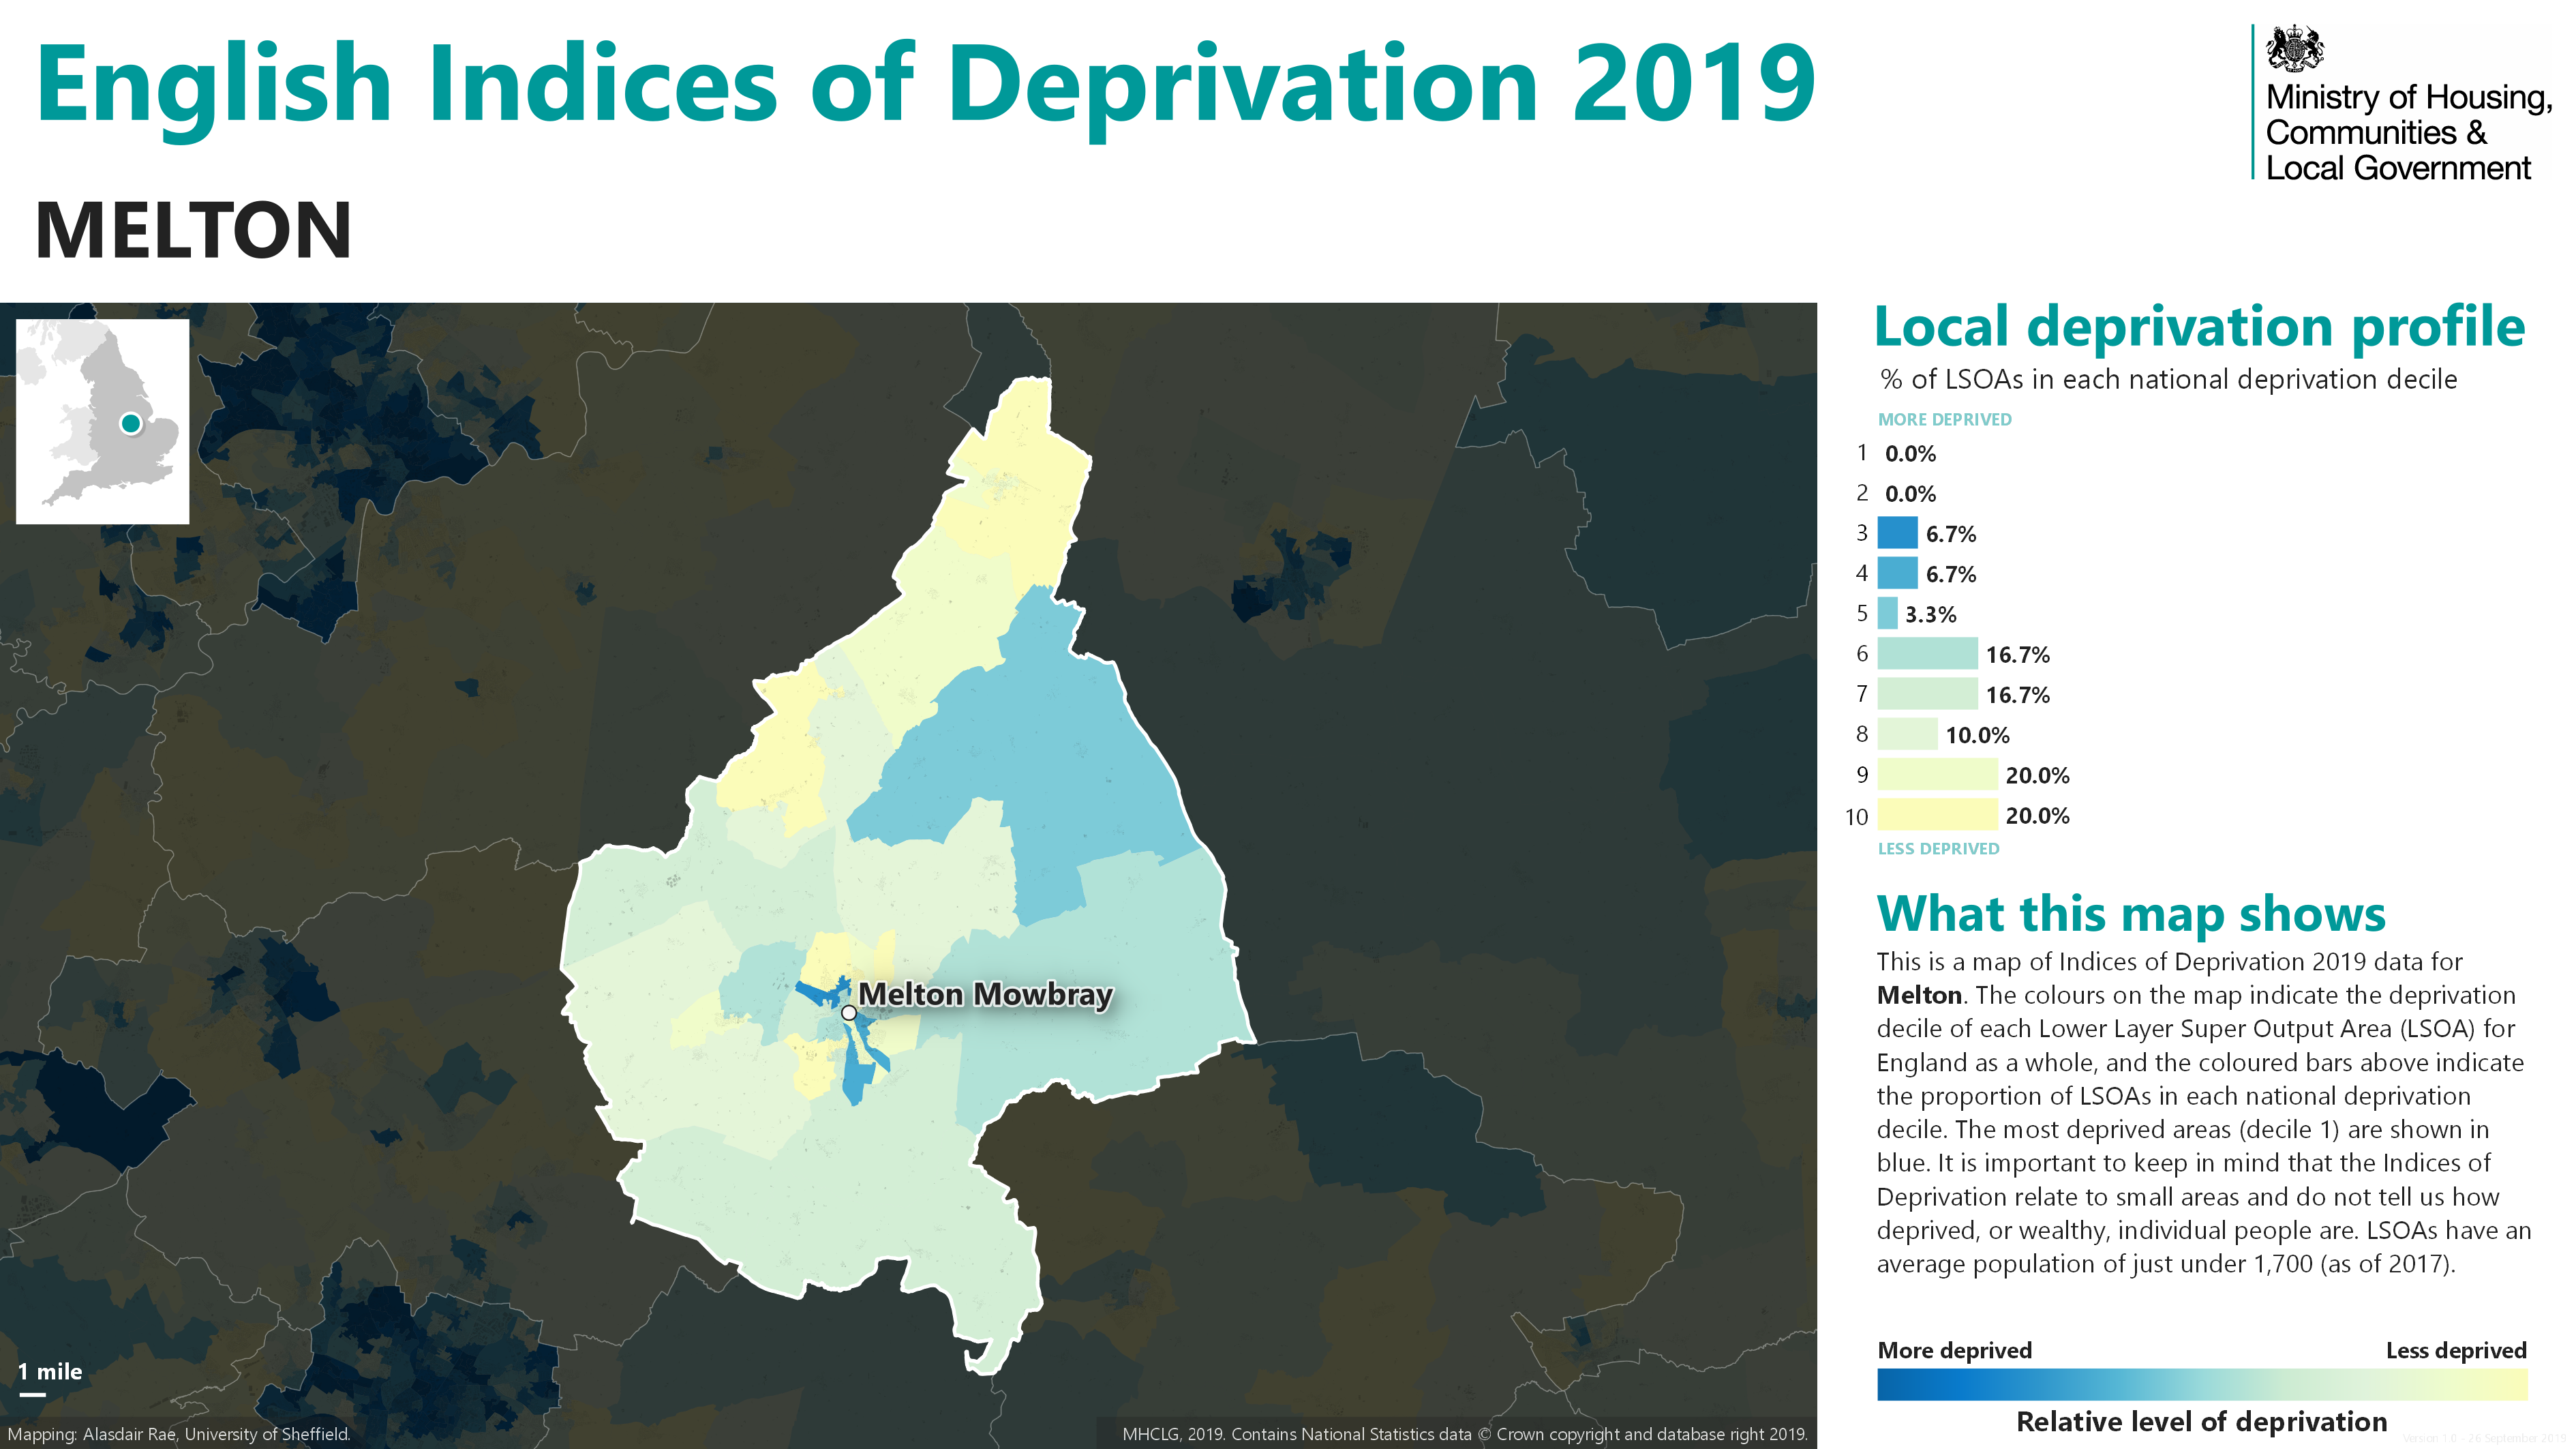
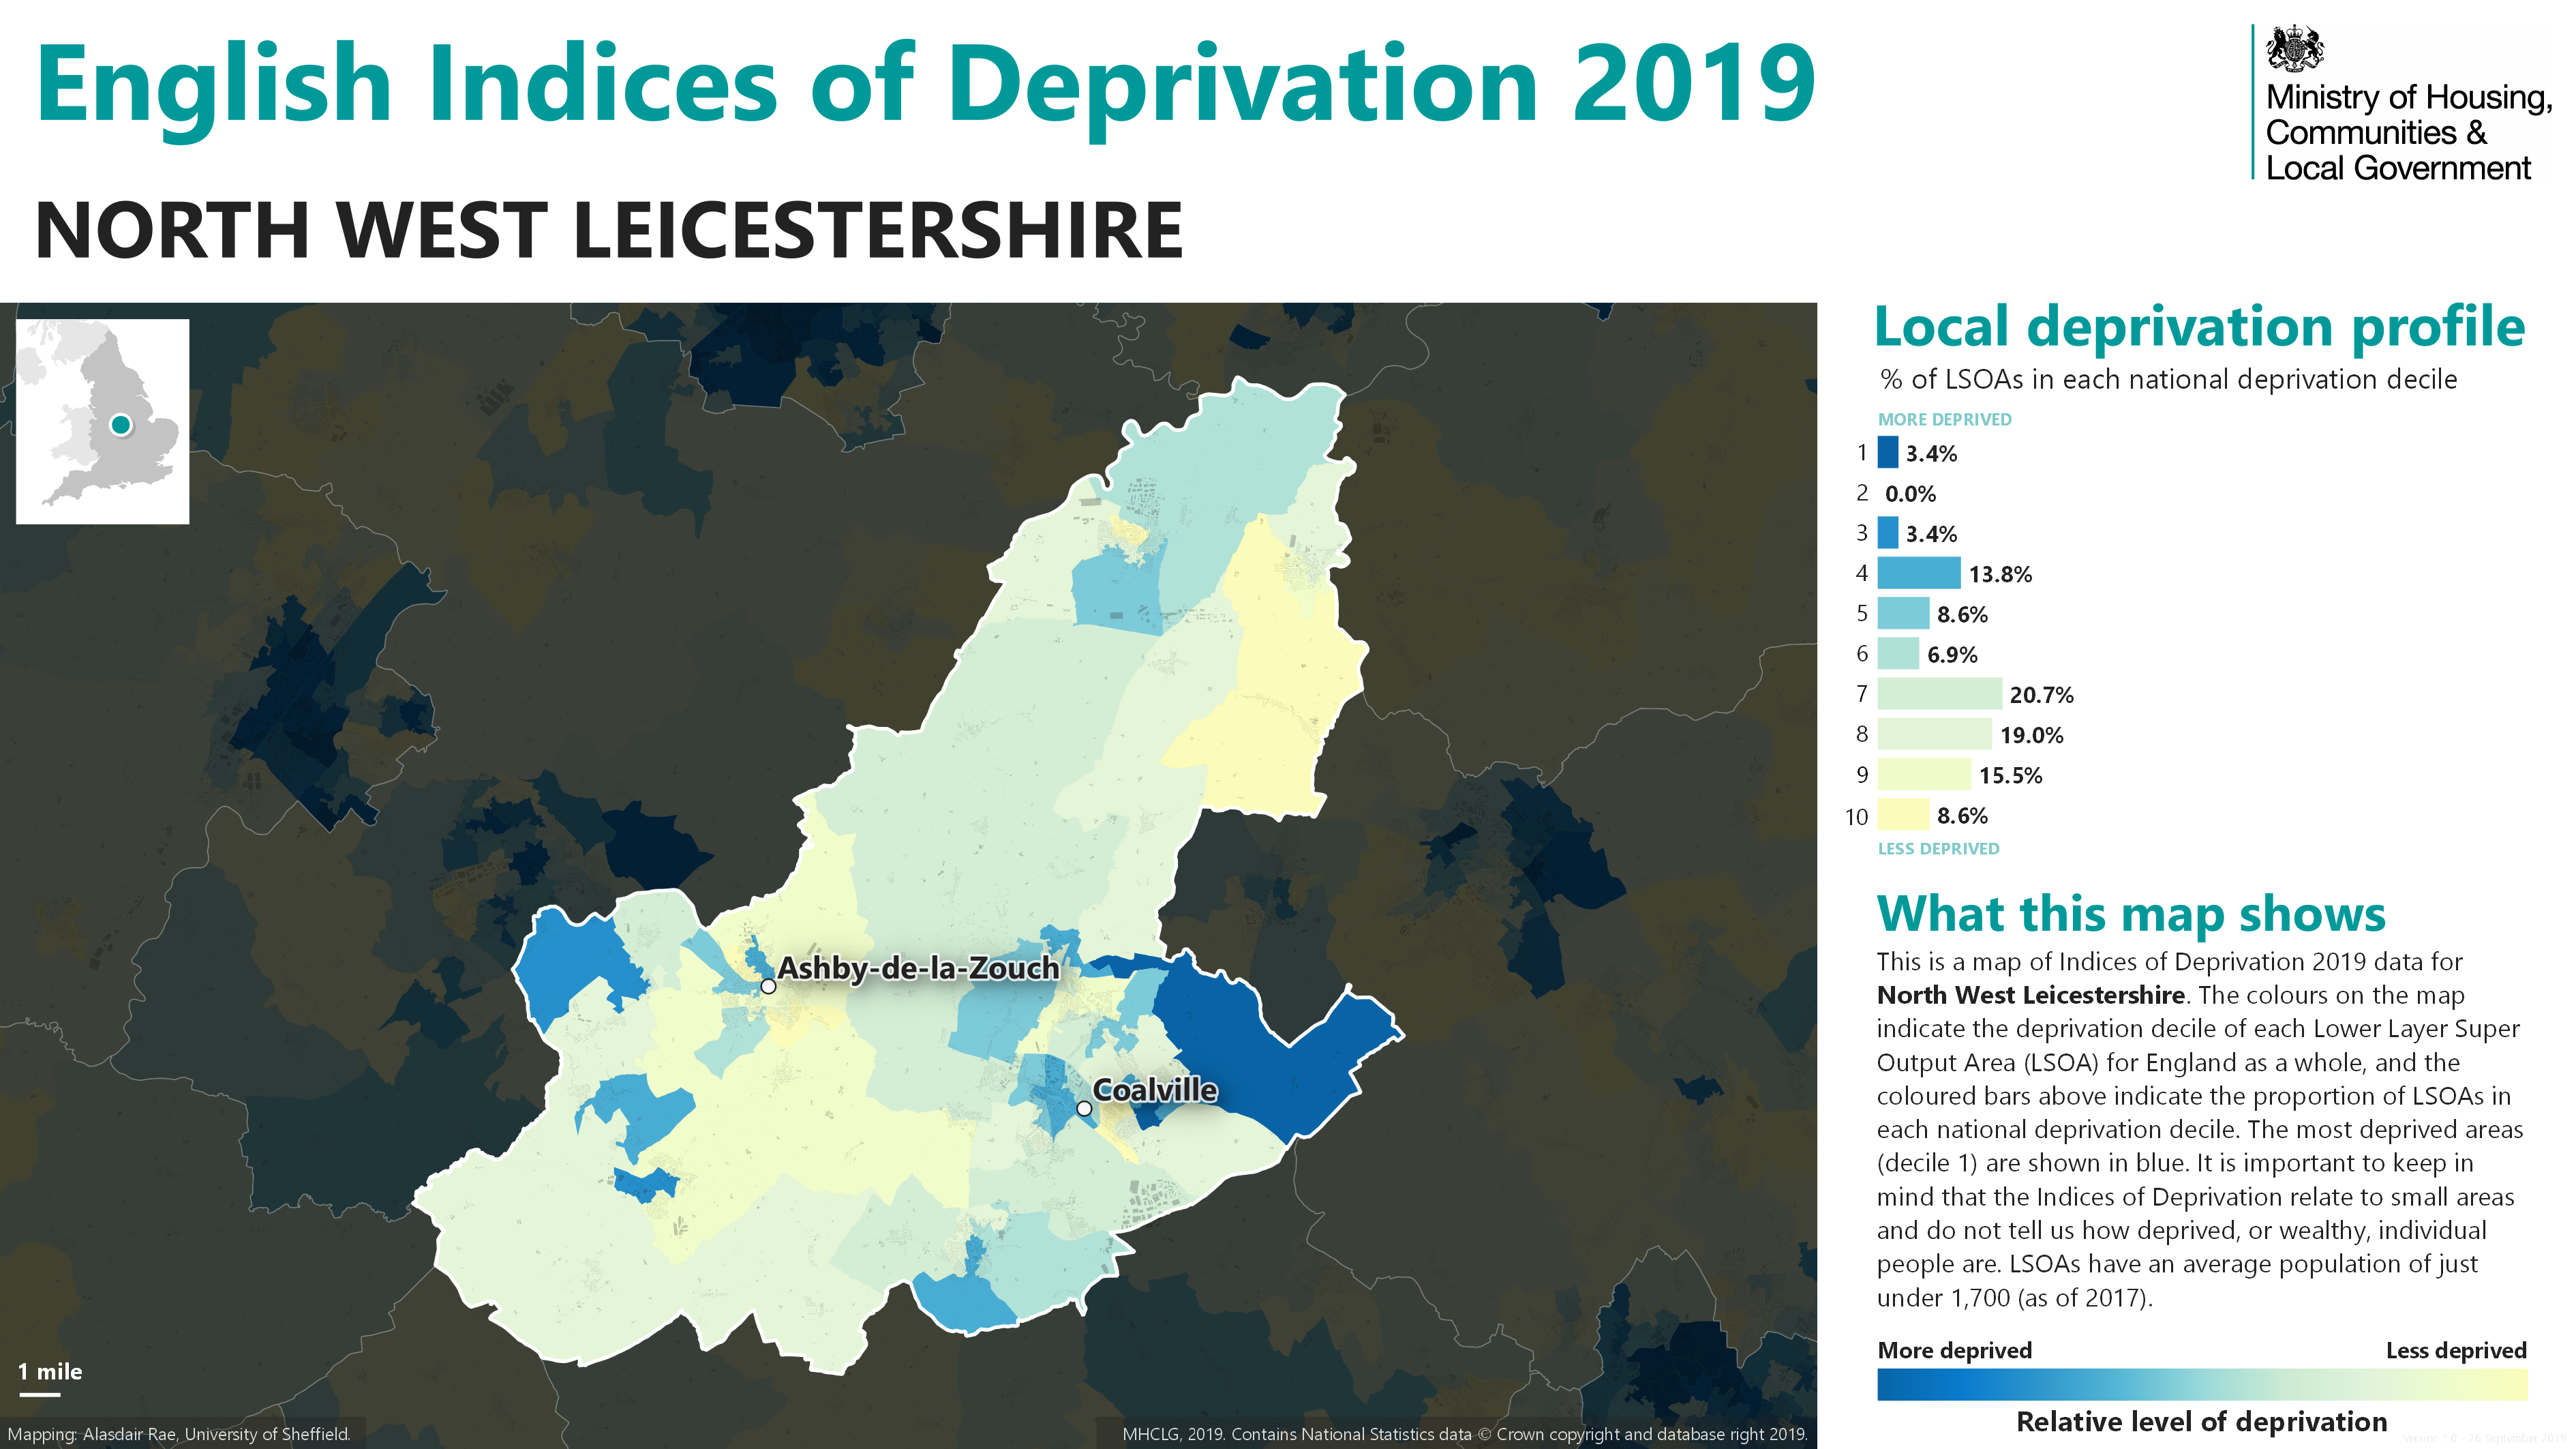
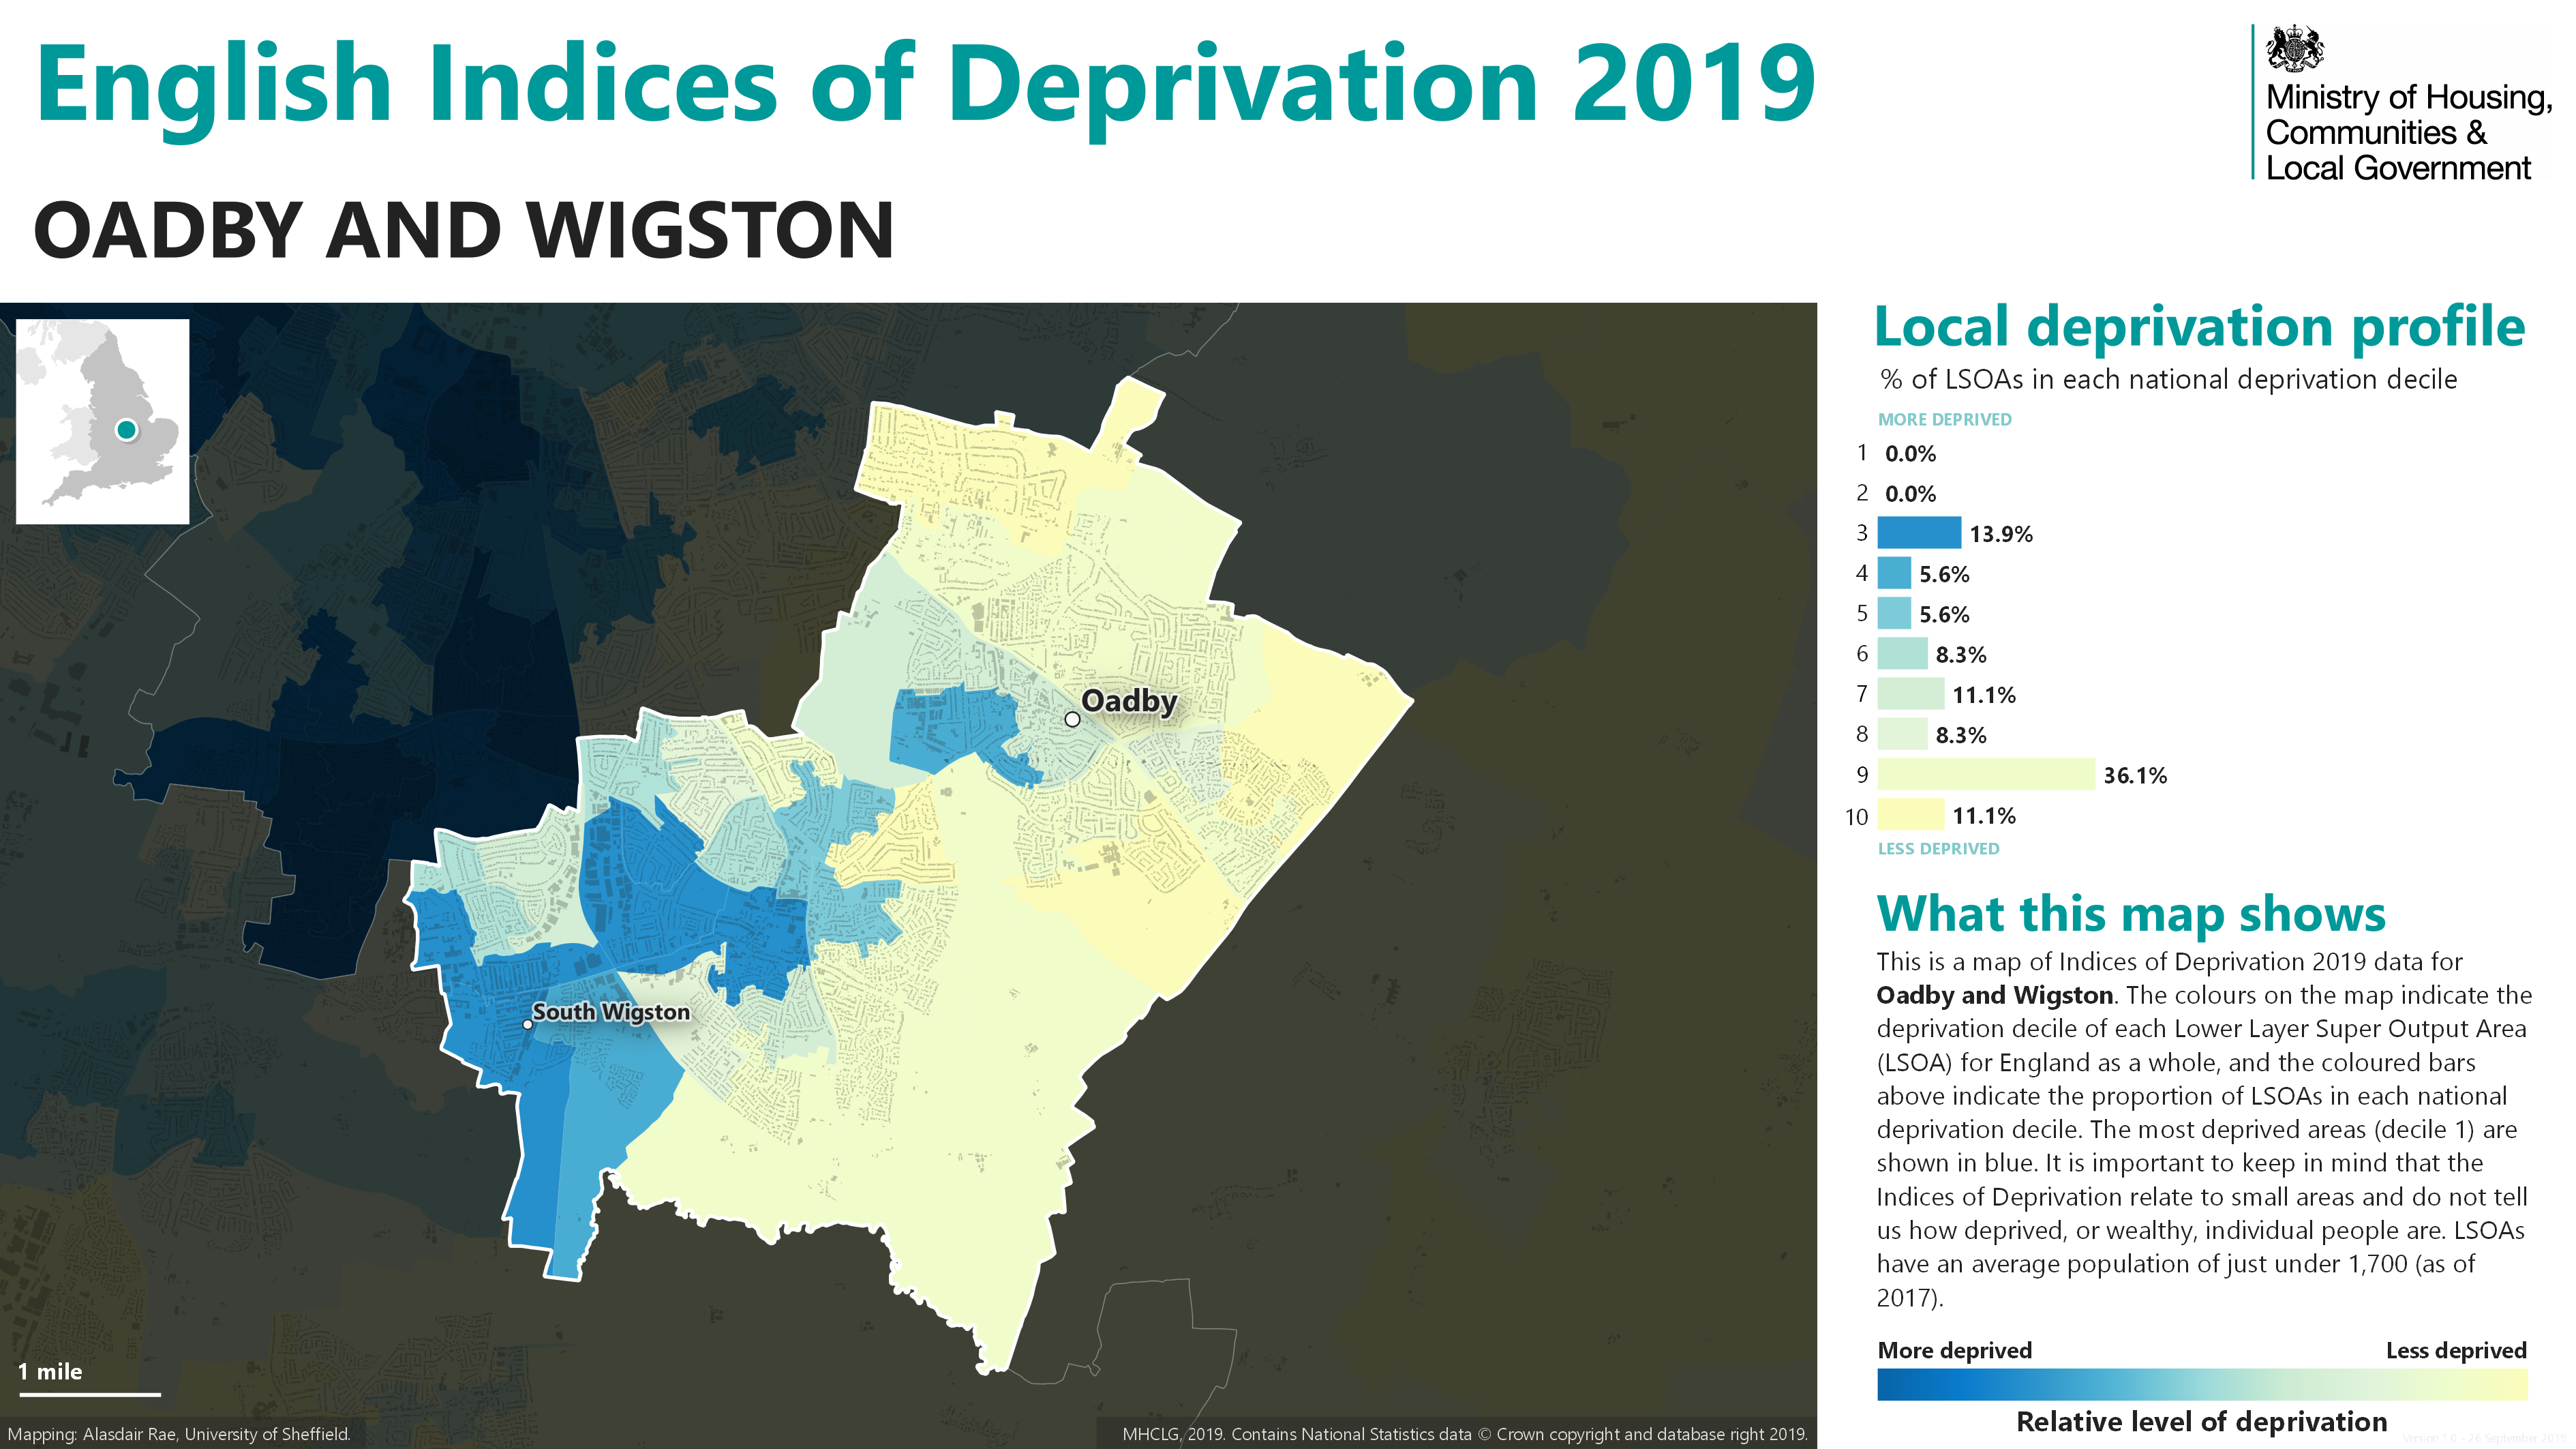
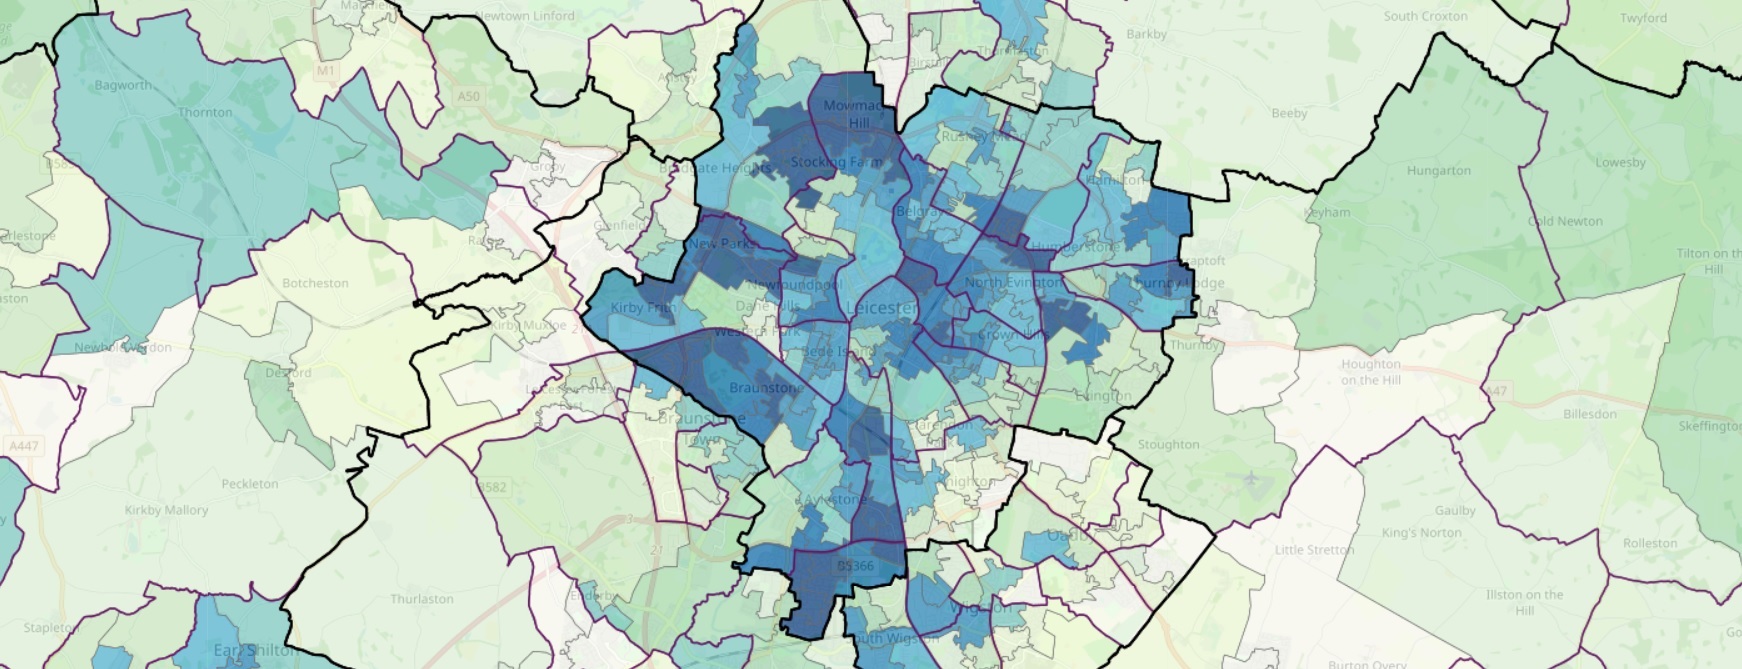
Maps of deprivation in Leicestershire
The following maps of deprivation were produced by the University of Sheffield and show deprivation within local authorities.