In this data brief we compare micro and small and medium enterprises (SMEs) across Derby, Leicester and Nottingham. We summarise: (a) the number of SMEs, and (b) the sectors they operate in.
Key findings
- Leicester has a relatively large number of micro businesses and SMEs compared to other cities in England.
- Nottingham has a relatively small number of micro businesses and SMEs compared to other cities in England.
- Leicester has a relatively large manufacturing sector, both compared to Derby and Nottingham, and other cities in England. This is largely driven by the textile and clothing sectors.
- Leicester also has a relatively large service sector, particularly in retail and wholesale, and auxiliary financial services.
- Derby has a relatively large number of SMEs in specialized construction and architectural and engineering activities.
- There are no sectors in which Nottingham has a relatively large number of micro businesses or SMEs.
Key charts
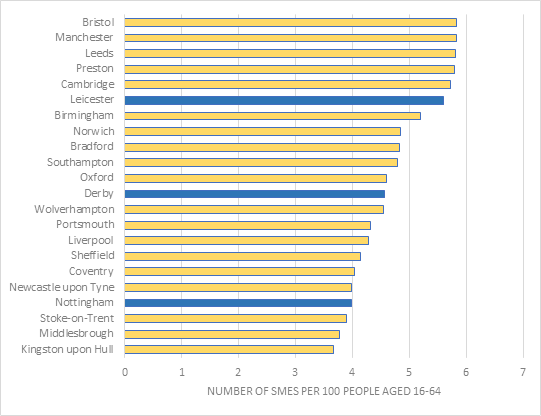
Our first chart gives the number of SMEs per 100 people of working age population. This is a snapshot from March 2020. You can see that Leicester has a relatively number of SMEs compared to the comparator groups of cities while Nottingham is towards the bottom of the list.
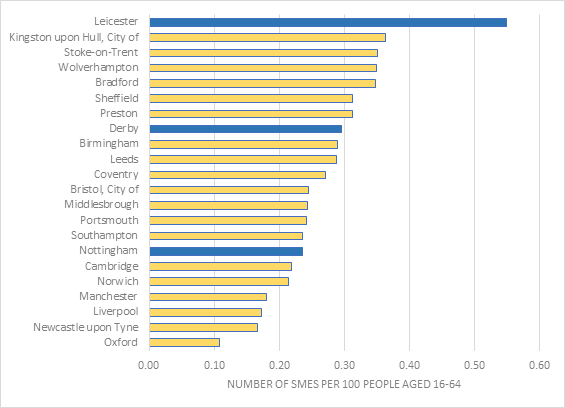
Our next chart gives the number of SMEs per 100 people of working age population in the manufacturing sector. You can see that Leicester is essentially ‘off the chart’ compared to other cities with far more SMEs in manufacturing. This is largely, but not wholly, driven by the textile industry in the city.
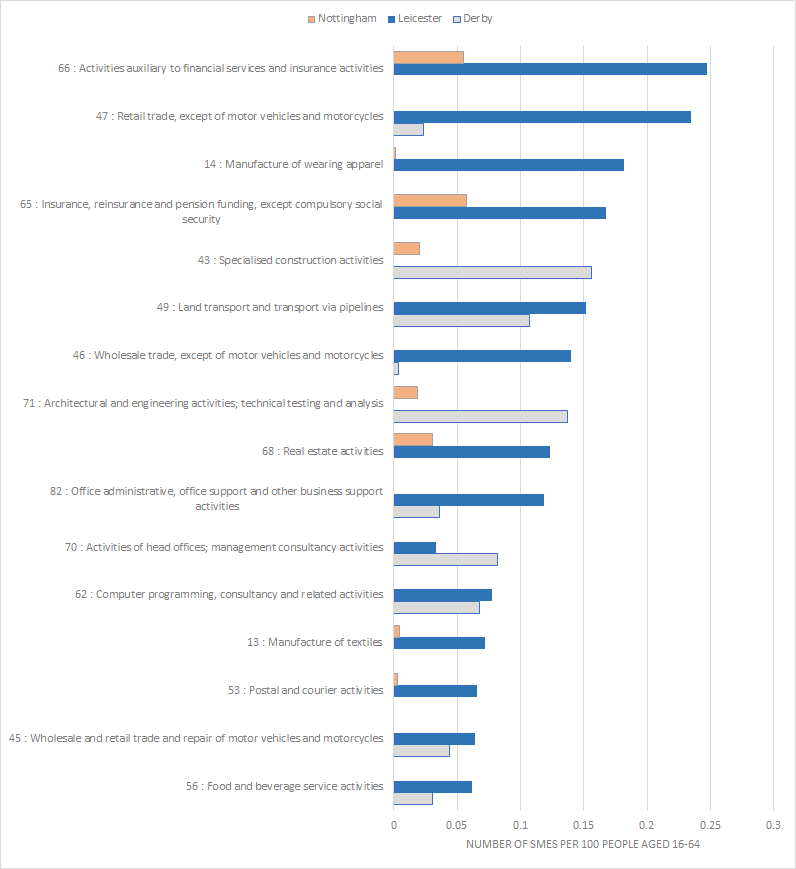
Our final chart looks to pick apart the differences in the three cities across sectors. A blue bar tells us that Leicester has relatively more SMEs in that sector compared to Nottingham or Derby. And a white bar tells us that Derby has relatively more SMEs in that sector. You can see that Leicester has more SMEs in a range of sectors but auxiliary financial services (e.g. mortgage brokers), retail trade and the textile/clothing industry are particularly prominent. Derby has relatively more SMEs in specialised construction and architectural and engineering activities.
The slides and data for this brief are available on EMEDRs FigShare account.
