
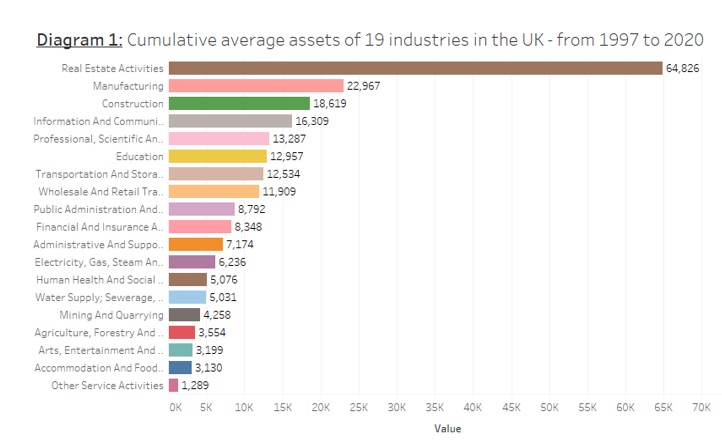
By using a recent report compiled by the Office for National Statistics, we are able to paint a picture of industrial investment in the UK from 1997 to 2020. The above diagram presents the cumulative average assets in each industry. It is worrying that the real estate industry had the highest cumulative average assets with a total value of £64.826bn, which was three times what is observed in the manufacturing sector. Investments in the Education sector, as well as in Professional, Scientific and Technical activities were only £13bn each. These figure explain the lag in productivity in the U.K. compared to other leading economies. According to the Office for National Statistics, the U.K. output per workers is way below what is observed in Germany, France and the U.S. The gap can be as wide as 30%. The growth of productivity in the U.K. has also the biggest drop among the G7 countries. From 1997 to 2007, productivity in the UK grew at an annual rate of 1.9%. However, from 2009 to 2019, this growth rate dropped to 0.7%, a change of -1.2 percentage points. During the same period, the drop in productivity growth among the G7 countries was 1 percentage point.
